No comments
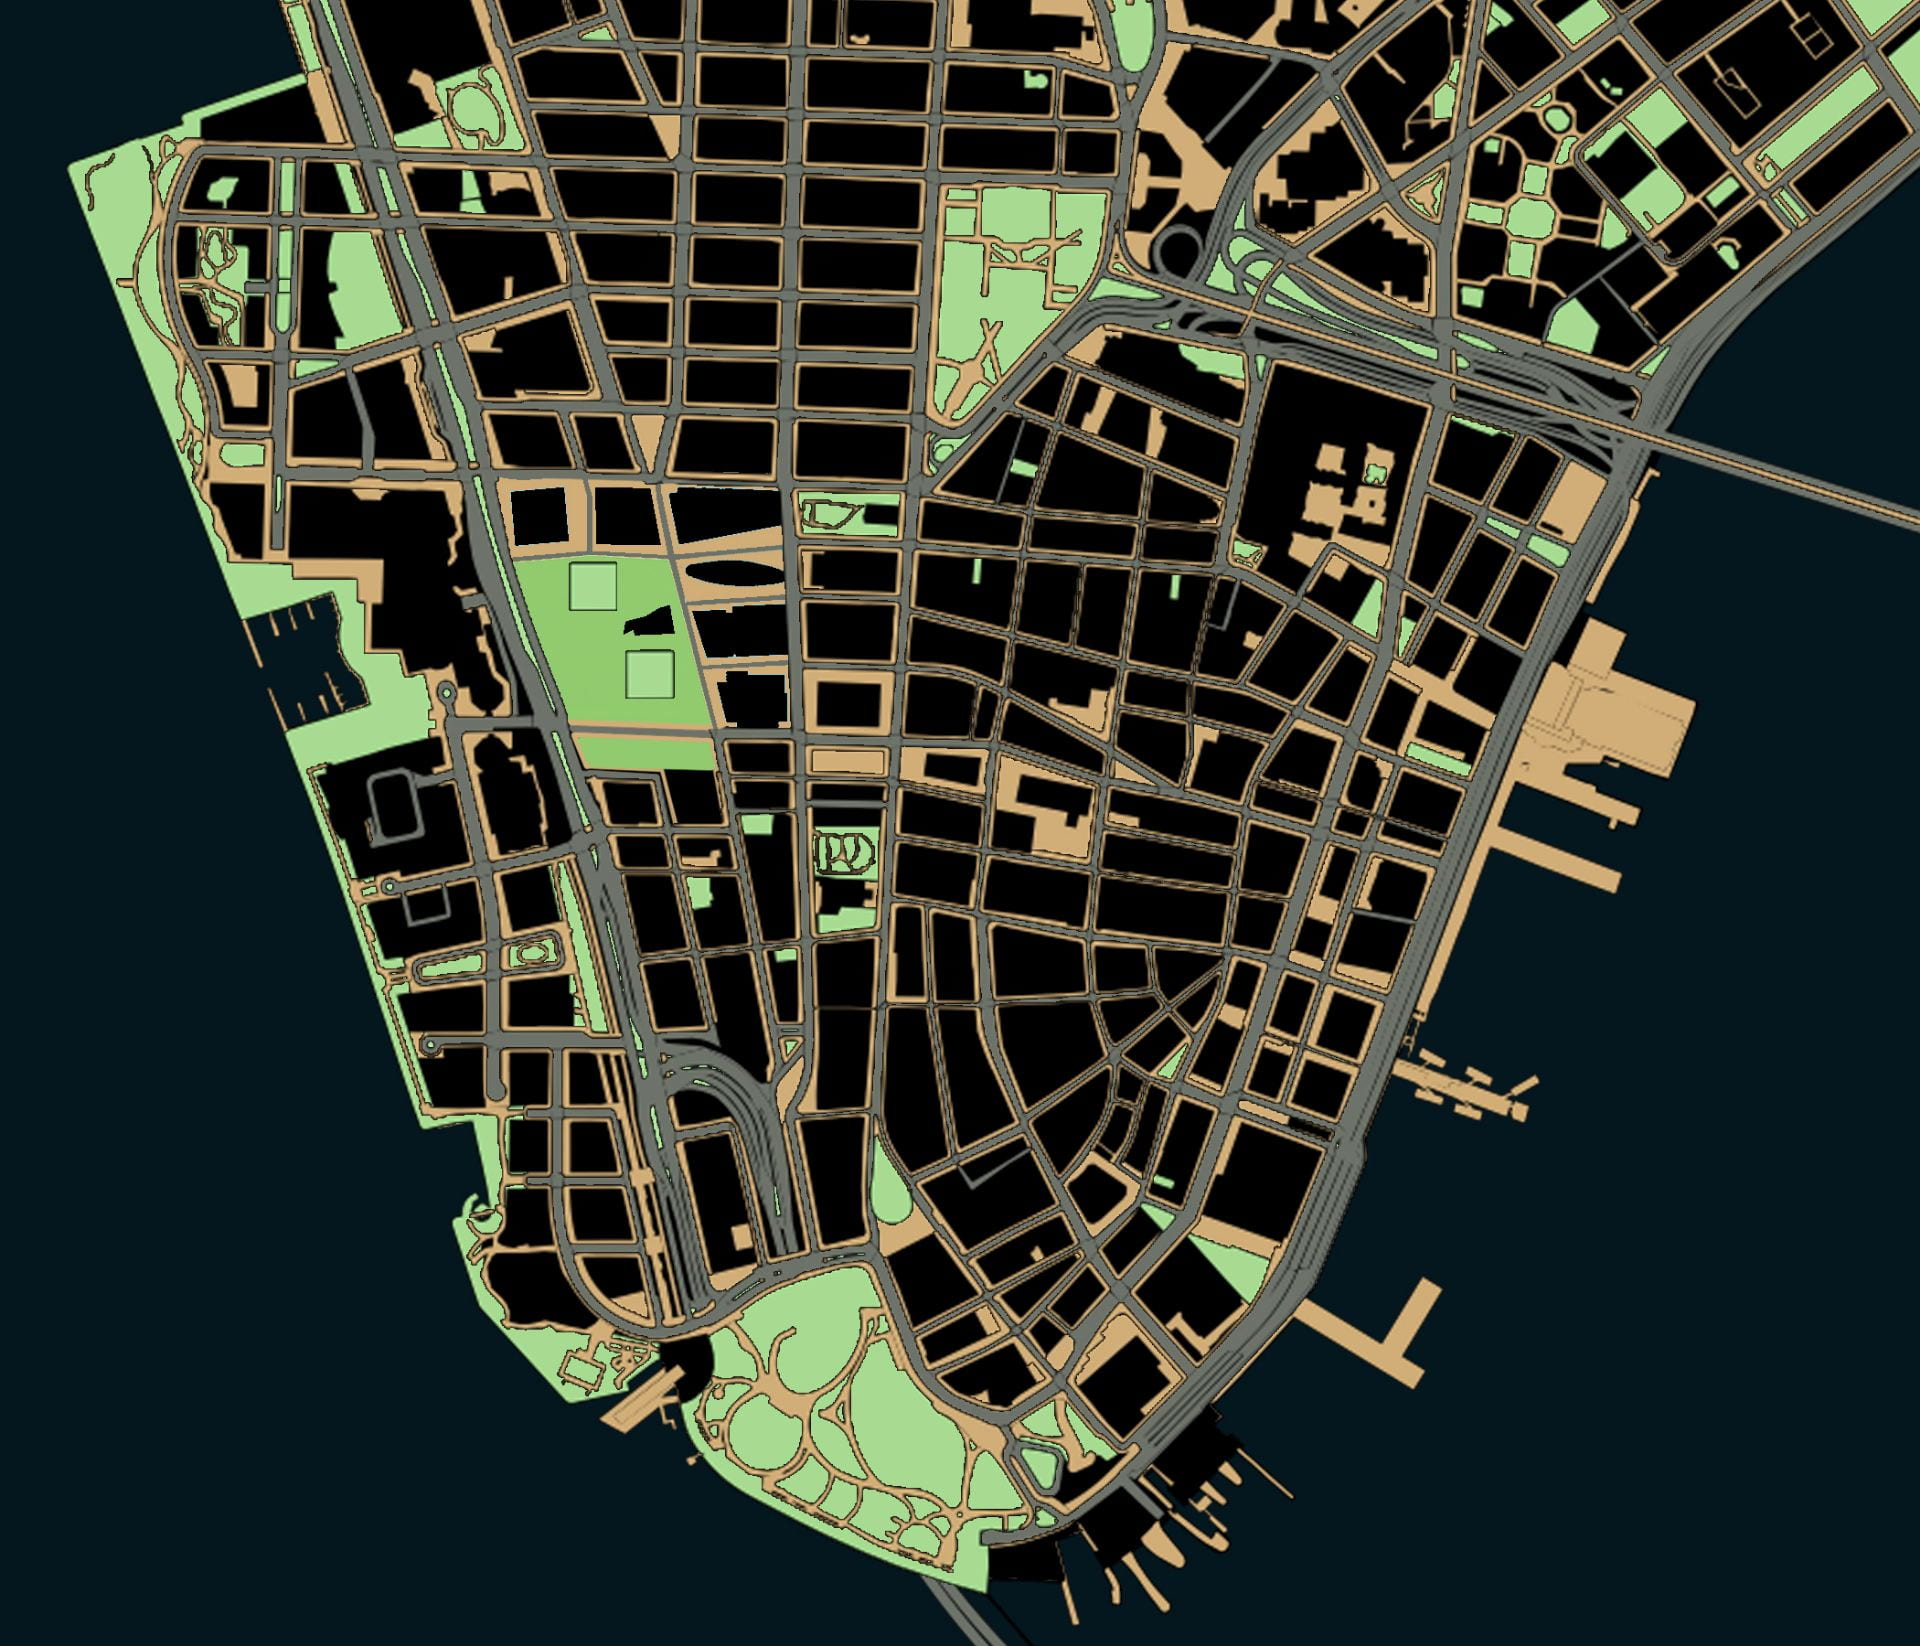
New York City Time-Lapse History by Eslam Ghazy
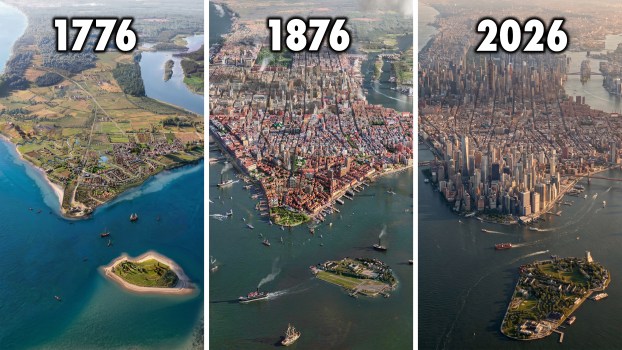
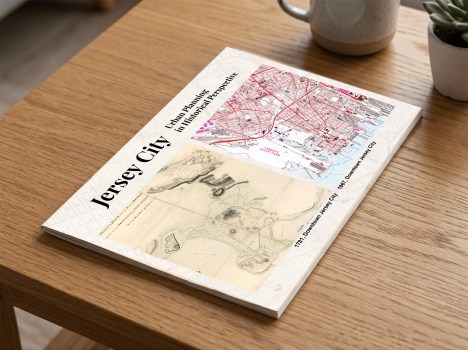
Follow the city’s time-lapse evolution from Dutch trading post to modern metropolis from a single, fixed camera angle. The project is based on extensive use of primary sources, century-old maps, photographs, and drawings from the collections the New York Public Library, Library of Congress, and Welikia map of pre-development NYC. VIEW PUBLICATION >