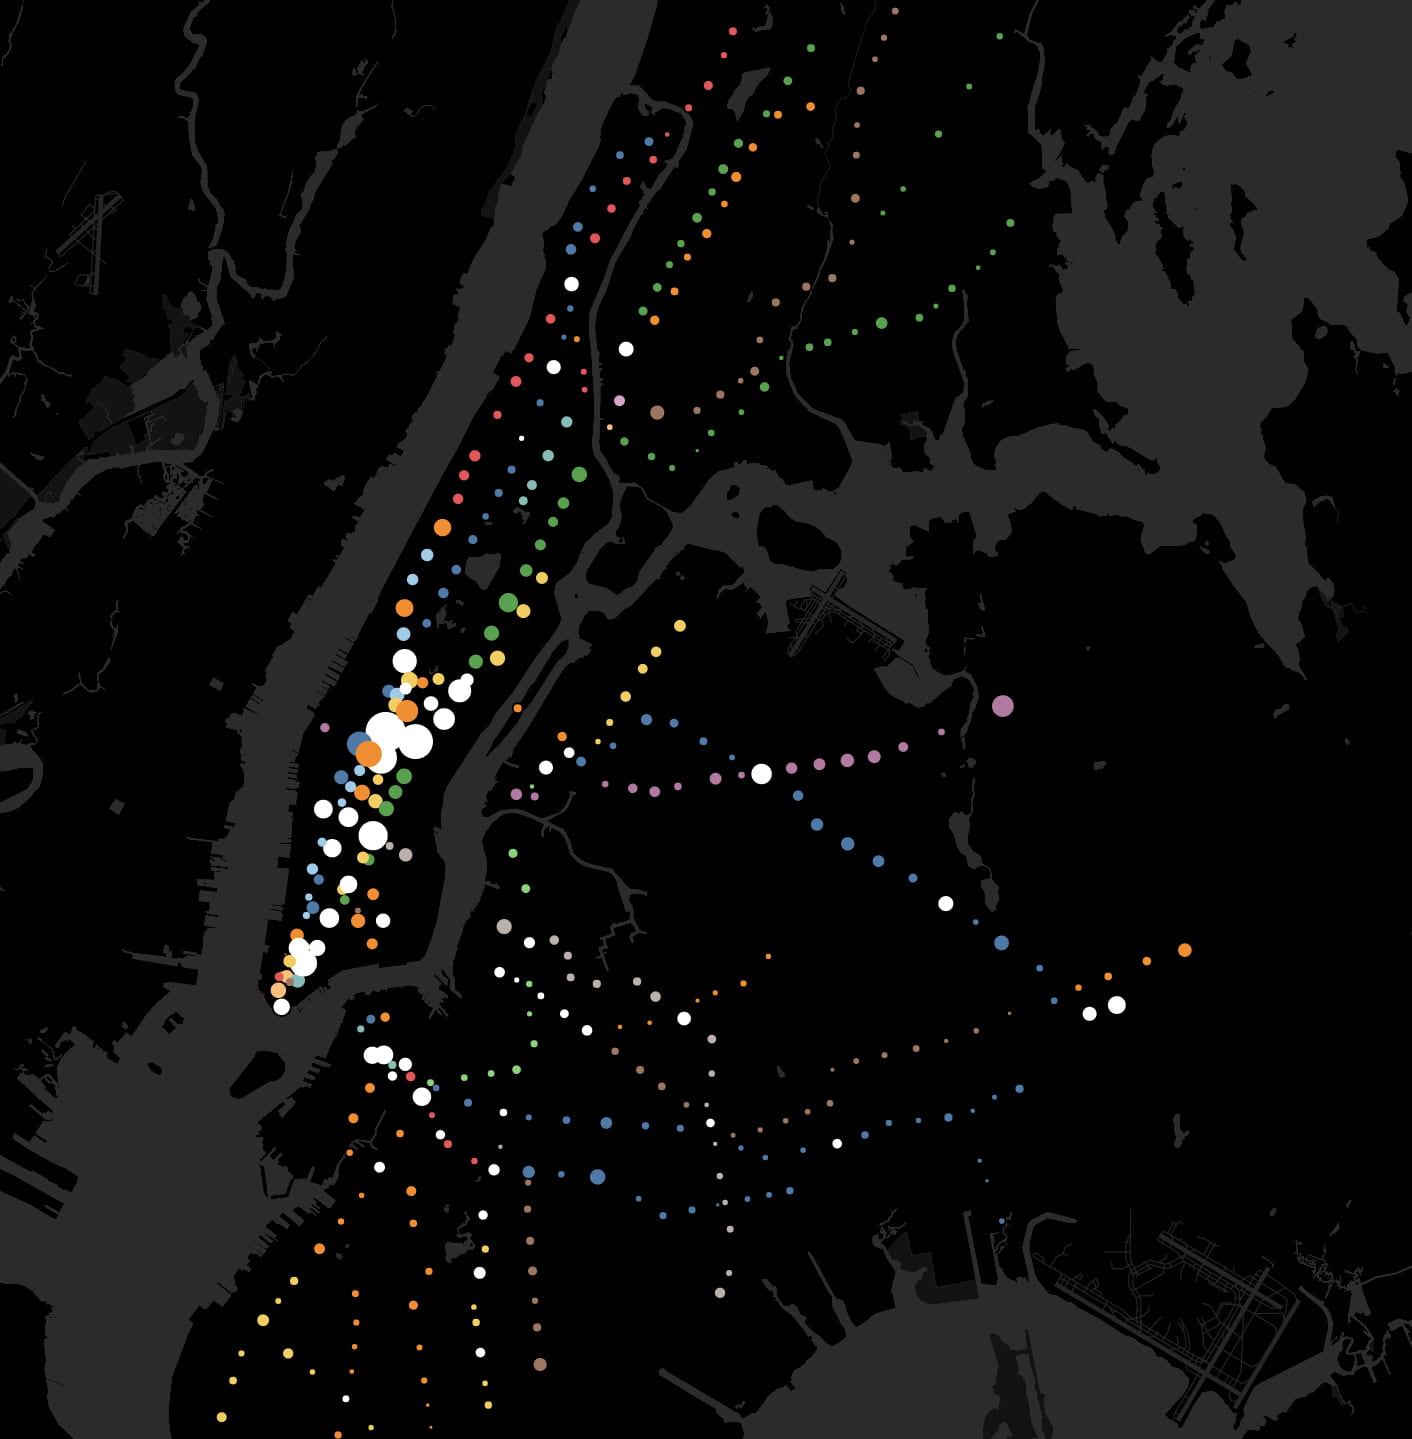
Created with data from the MTA.
Published by Gothamist on 22 January 2019.
Related: my data visualization of London Underground commuting patterns.
.
The visual language of data addresses a deeper need to humanize and soften the concrete jungle.
.
Sounds of breathing, heartbeat, and subway from Freesound
.
In this animation based on subway ridership statistics by station:
● Dots are color-coded according to the subway lines they serve.
● White dots are for junctions between two or more lines of different color.
● Dot size corresponds to the number of riders entering each station within a 24 hour period.
● Larger dots are for busier stations. Smaller dots are for less busy stations.
Movements through the New York City subway are analogous to rhythmic breathing.
People often describe cities in relation to the human body. Major roads are called “arteries” in reference to blood flow. The sewers are the city’s “bowels” in reference to our own digestive systems. Central Park is the city’s “lungs.” At various times in history, key industries like garments and finance were described as the “backbone” of New York’s economy. Although cities are complex organisms, wordplay makes the giant metropolis somehow more human and familiar.
The 424 subway stations and 665 miles of track are analogous to the human circulatory system. Every weekday pre-coronavirus, the subway carried 5.4 million people, mostly commuters. This daily commute is ordered, structured, and rhythmic – as Manhattan’s population swells during the daily commute and then contracts by night. Each passenger symbolizes the movement of a single red blood cell. With each paycheck, the oxygen of capitalism flows from the heart of Manhattan to the cellular homes in the outer boroughs.
Commuting patterns mirror the rhythmic expansion and contraction of the human body while breathing. By contrasting weekday and weekend ridership patterns, we detect the city’s respiratory system.
.

.
Interactive Map
.
Research Method
In this video lecture, I walk you through how I manipulated MTA and NYC open data
to create this animation.
.
The Metropolitan Transit Authority (MTA) publishes statistics on weekday and weekend (Saturday + Sunday) ridership for all 424 stations. These statistics, updated yearly, are public and can be analyzed to track trends in urban growth. I downloaded the MTA data and assigned each station a geographical coordinate (latitude + longitude) so that the data points would appear at their corresponding map locations.
I have a love-hate relationship with the New York City subway. At rush hour, it is crowded, hot, and slow. From years of riding its squeaky trains, it’s given me a ringing tinnitus sound in my ear. Despite its flaws, the subway is one of the few urban spaces where all social classes and ethnicities mix, where their separate lives are momentarily shared. Rich or poor, everyone rides the subway. I hope this animation renews appreciation for this engineering and the people behind it.
.


