• This website includes dozens of videos, hundreds of essays, and thousands of drawings created over the past twenty years. Search to learn more about the history of buildings, places, prisons, Newark, New York City, and my PhD research on spatial inequality.

  • Or scroll down for the latest publications.

The Geography of Art History

According to the Metropolitan Museum of Art

.

Related: Data analysis and visualization of 120,000 works in the Museum of Modern Art

.

.

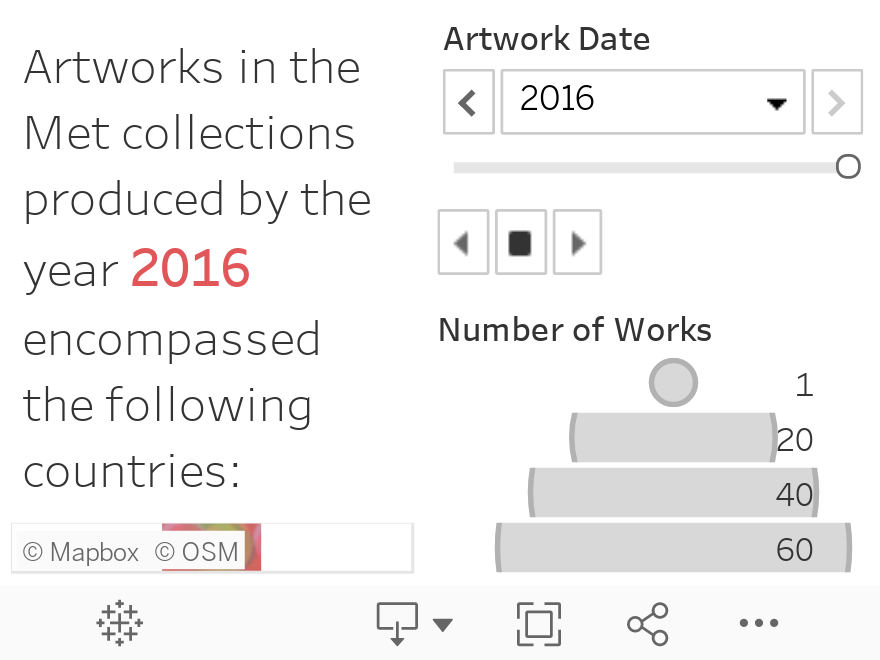
In this film, each colored dot indicates one location represented by art in the Met’s online database. Dot location indicates artwork provenance. Dot size indicates the number of objects from this place. The time each dot appears corresponds to the year this work was created. This data is assumed to be an accurate sample size.

.

Over the past few years, the Metropolitan Museum has catalogued over 25% of its holdings online. This represents ~590,000 objects, covering over 5,000 years of human history from 17 curatorial departments. The diversity of objects in a museum’s collection (and the amount of contextual information known about these objects) may reflect the kinds of narratives a museum can curate about artistic and global history. This visualization charts the provenance and year of production of every single object that is catalogued on the Metropolitan Museum website, whenever this information is known.
The geography of art history is uneven. Certain regions, particularly cities, are home to diverse and famous artistic output. Thomas Friedman similarly describes globalization as being spiky and concentrated in big cities. Other regions are comparatively less productive and less studied. Either this reflects museum curators’ historic bias against Africa, Latin America, and the “Global South” in favor of Europe. Or this might reflect a more fundamental historical reality: If geography guides artistic production and privileges regions with good geography, like areas surrounding the Mediterranean, then landlocked and inaccessible regions with poor geography will have less artistic output.

.

.

Art objects from ancient cultures like China, Egypt, and Sumeria frequently have known provenance but unknown year of production. Unfortunately, they are therefore excluded from this visualization. There are many objects in the collections with known provenance but unknown production date. Figure one illustrates objects with known provenance and known year. Figure two shows objects with known provenance only.

.

.

The original data was downloaded here from the Met Museum’s website.
This visualization and interactive map are free to view and download here.

Interactive surface parking map of central Newark

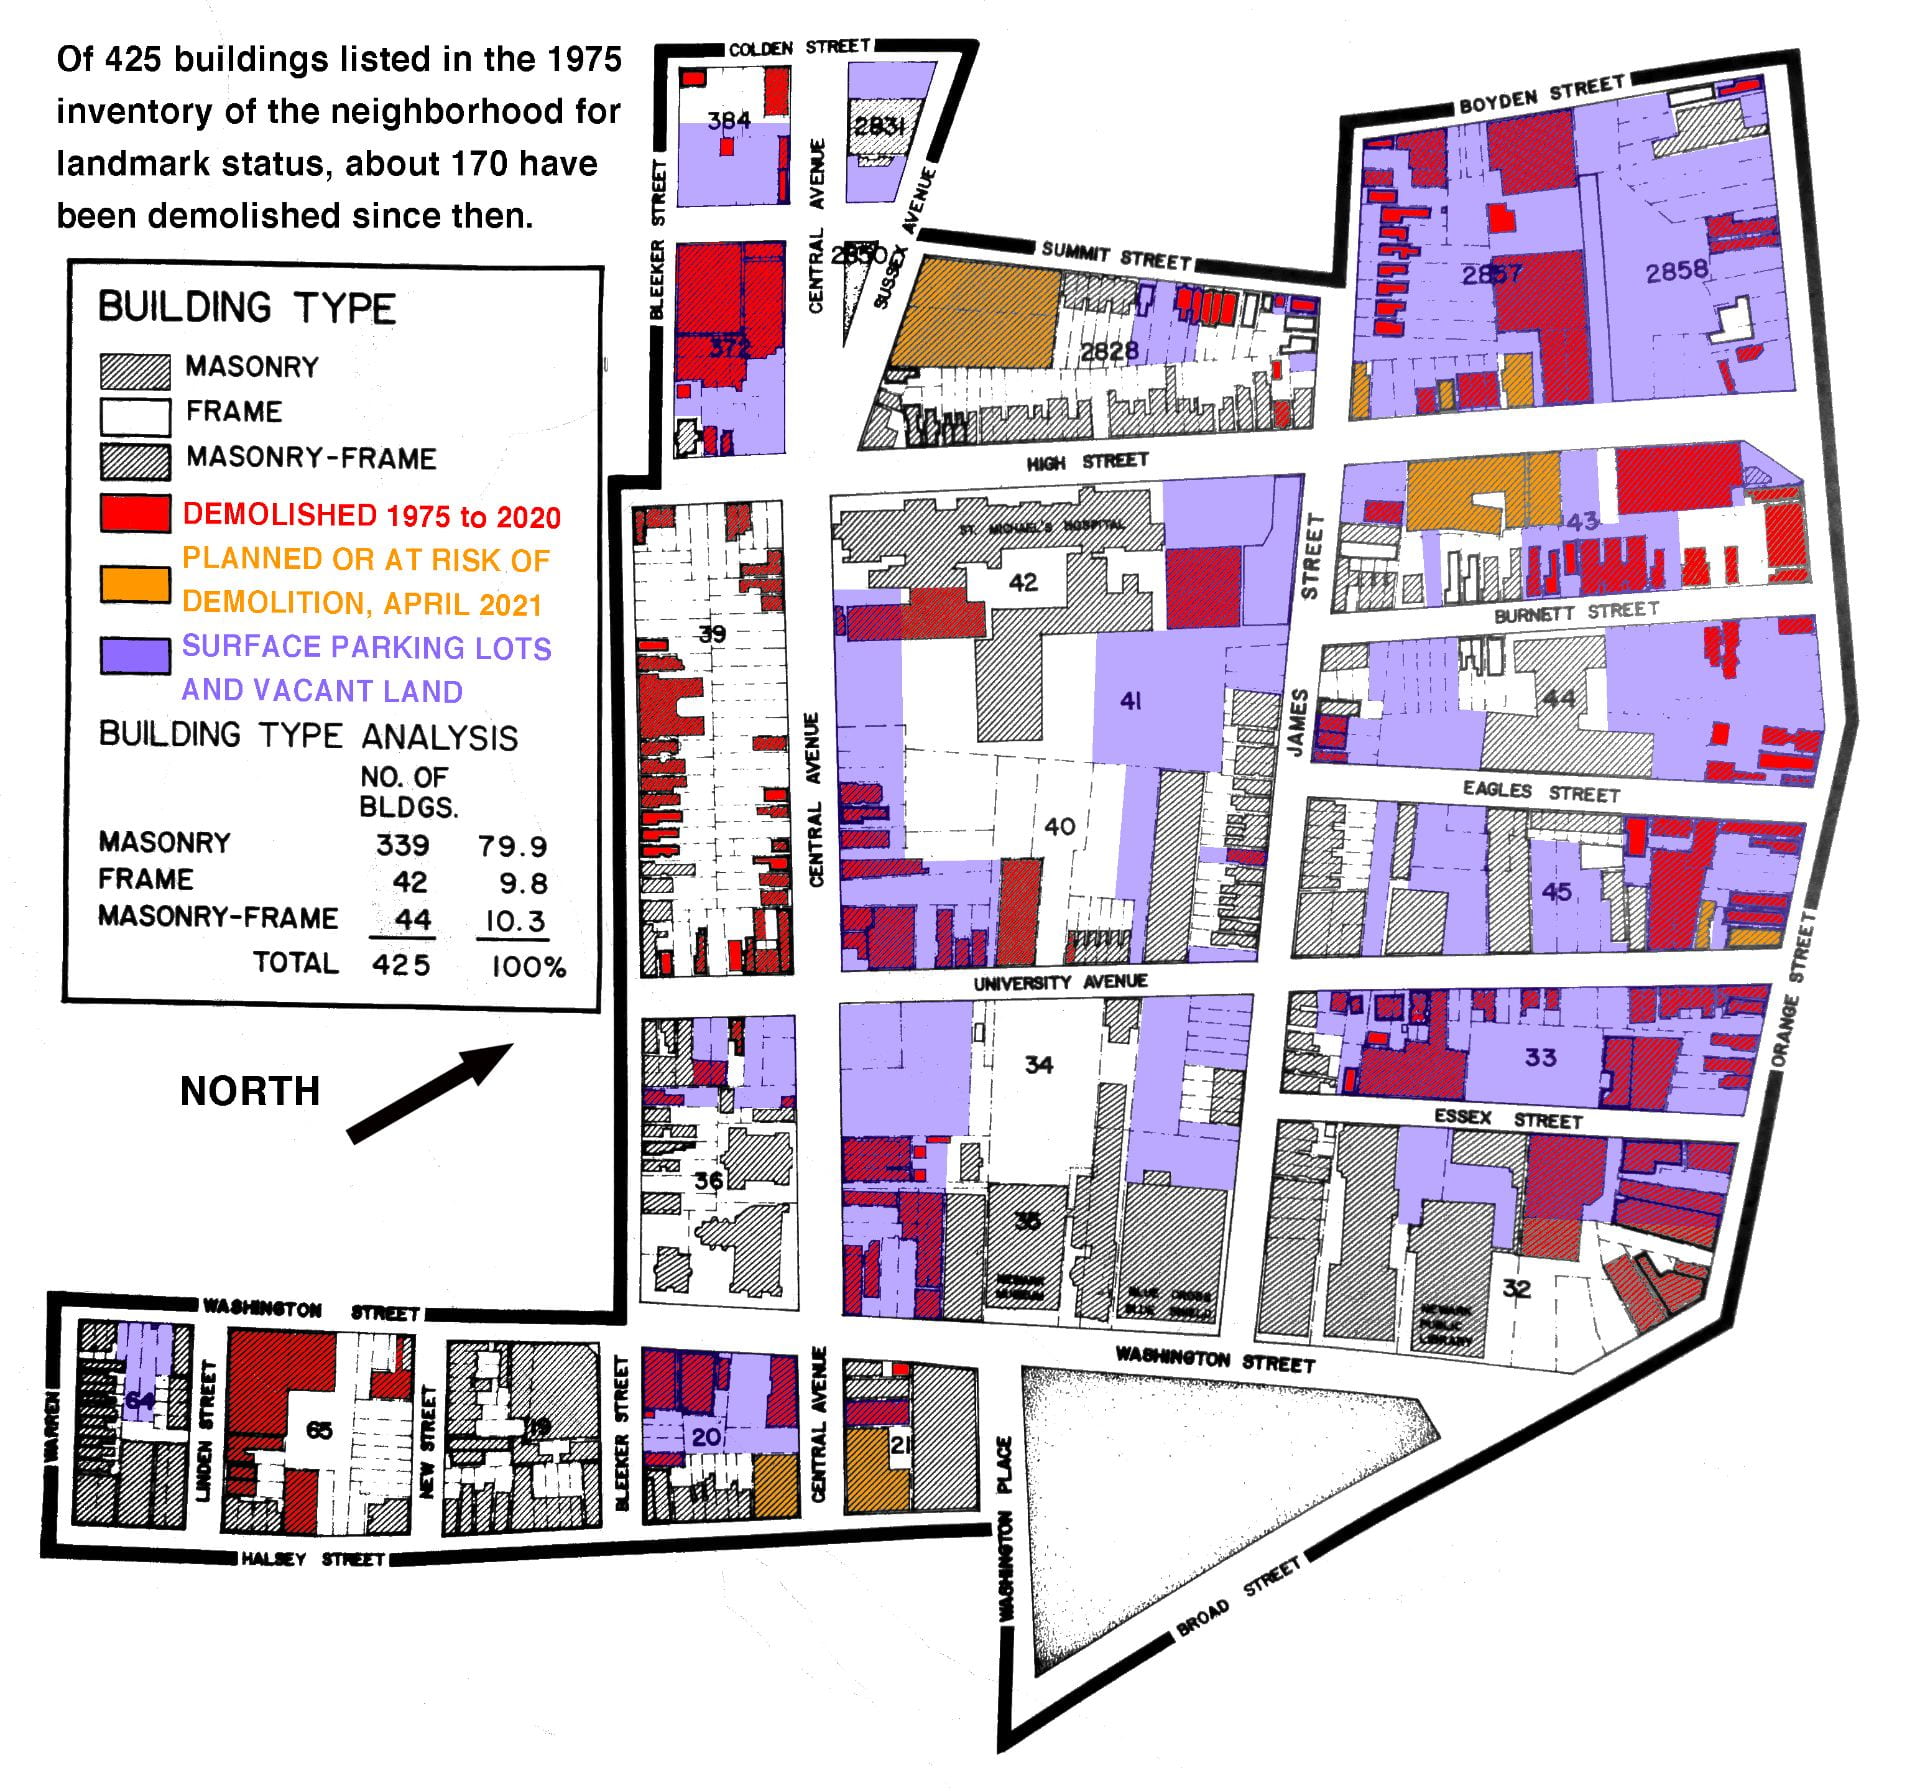
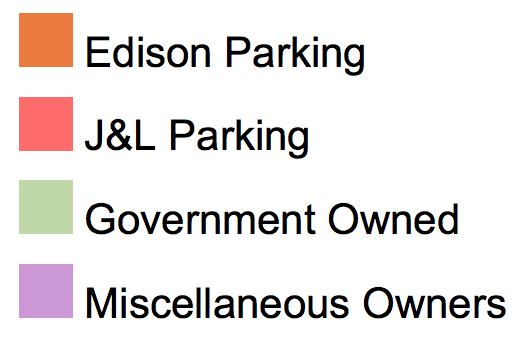
Explore an interactive map of the 300+ acres of parking in Downtown Newark. This map is part of PLANewark’s ongoing fight against the expansion of surface parking in Newark. Click the rectangle icon on upper right hand corner of map to view full screen. Click on individual, color-coded lots to view information on the property owner and acreage.

.

Interactive map of Newark’s blight of parking

.

.

Destruction of the James Street Commons: 1975-2020

This map (accurate as of April 2021) illustrates buildings demolished in one Newark neighborhood, the James Street Commons. When historians first considered this neighborhood for landmark status in 1975, there were 425 historic buildings. Even after earning landmark status in 1978, demolitions and urban decay continued. Rutgers, Edison Parking, St. Michael’s Hospital, and the New Jersey Institute of Technology have demolished dozens of old buildings, mostly to construct surface parking lots as an “interim” land use. It is time that the local and state governments be more proactive in preserving the city’s history.

.

Zoning and Affordable Housing in Newark

Featured June 2017 in this NJ.com news article about my computer simulation

.

.

In the summer of 2017, I helped oppose the gentrification and rezoning of a neighborhood in my city. The area was zoned for buildings no higher than eight stories, which was respectful of the small and community scale of the existing structures. City officials, however, proposed rezoning a large section of the area  to permit structures up to eighteen story structures – four times taller than any other structure in the immediate area.
Motivated by profit, the J&L Parking Corporation lobbied the city to increase the maximum allowed height on their land. Though they had little intention to build anything, this zoning change would increase the value of their property when they decided to sell it in the future. In what is called “spotzoning,” the zoning changes were drawn to exclusively benefit J&L’s properties and the parking lots of the nearby Edison ParkFast corporation.
I created a computer simulation of how the area would appear if the proposal passed and the neighborhood was built up to the maximum density allowed by law . This computer simulation was shown to city officials to inform the planning process.

.

.

City Council Speech

September 19, 2017

.

.

I’d like to speak on why opposing MX-3 is consistent with supporting inclusionary zoning.
To my knowledge, 7 members of the City Council voted in favor of inclusionary zoning. This is an important move to protect our city most vulnerable residents and to preserve affordable housing in our downtown.
MX-3 and upzoning will jeopardize this important piece of legislation.
Why?
inclusionary zoning kicks in when (firstly) developers build structures over 30-40 units and (secondly) they request a variance to build this structure.
When an area is zoned for larger and taller structures developers can build more and larger structures WITHOUT requesting a variance to build larger. And when developers do not need to request a variance for height, it is less likely they will need to include affordable housing in their project.
In effect, MX-3 will remove the requirement to build affordable housing in the effected area. When zoning is overly generous to developers and zoning permits overly large scale, develops do not need variances. And when developers don’t need variances, they do not have to built affordable housing.
In addition, since MX-3 could be expanded to anywhere within a half mile radius of Penn Station, it is quite possible that MX-3 could be expanded in the future. In effect, this would eliminate the requirement for developers to build affordable housing in this area. Upzoning does not benefit affordability.
Secondly, what is sustainability?
Sustainability and transit-oriented development is not just about a short distance to Penn Station. It is not just about green roofs or any type of development.
Sustainability is about affordable housing that we the people can afford to live in. We don’t want luxury condos for the 1% in the MX-3 area. We want development that our residents and you can afford.
All of us can agree that WE ALL WANT DEVELOPMENT. But we want development that is 1. Affordable 2. Respectful of the Ironbound community. And 3. Respectful of our city’s diversity and history.
MX-3 is none of these things. It is about landbanking and benefiting the 1% wealthiest outside our city. I encourage you to strike down MX-3 and to encourage instead an open dialogue with the community about SUSTAINABLE and AFFORDABLE development in our city.
Developers should come to Newark and development should happen. However, we should not upzone entire sections of our city, in effect removing the requirement for affordable housing, undermining the inclusionary zoning we just created, and jeopardizing the recent master plan we created with public participation.