• This website includes dozens of videos, hundreds of essays, and thousands of drawings created over the past twenty years. Search to learn more about the history of buildings, places, prisons, Newark, New York City, and my PhD research on spatial inequality.

  • Or scroll down for the latest publications.

Street Grid Development vs. Population Density

Adapted from Shlomo Angel and Patrick Lamson-Hall’s NYU Stern Urbanization Project,
here and here.

.

The animation at left shows street grid development from 1801 to 2011, mapping Manhattan’s gradual expansion north. The animation at right shows the population density over time of each census tract in Manhattan. Notice how Manhattan’s population density rises and peaks around 1900 before falling to present levels. Despite Manhattan’s appearance of being denser and more built up with skyscrapers than ever before, the island actually has a lower population density than a century ago.

.

.

Before the introduction of subways in the early twentieth century, the difficulties of commuting distances over land and water drove a denser form of urbanism than today. By 1900, the island of Manhattan had over 2.3 million residents in comparison to only 1.6 million in 2020. These people were crowded into dense blocks with upward of half a million people per square mile. The subways had not yet opened, suburban sprawl had not yet arrived, there were no rail connections under the Hudson River, and Manhattan had few or no road connections with the other boroughs and the mainland. This produced an island of remarkable density with the Lower East Side the densest place on earth, while only a few miles north, Harlem remained almost rural.
In 1903, the Williamsburg Bridge over the East River linked the Lower East Side with undeveloped Brooklyn. The trolley lines, subways, and roadway that stretched over the Williamsburg accelerated the development of Brooklyn, first in the higher density parts of Brooklyn closest to Manhattan and later to the distant parts of Brooklyn and Queens with suburban population densities. Suburban growth started earlier than the 1950s image of Levittown, and with the movement of people outwards from Manhattan, the centers of immigrant cultural life shifted, too. In every following year, the Lower East Side lost people, arriving at a density in 2020 only a sixth of what it was in 1900.
Over the following decades, improvements in public transportation and the introduction of the car “smoothed” out the population density. At the same time, Manhattan’s street network expanded to cover the whole of the island from end to end. As the subways made commuting easier, people no longer need to live within walking distance of where they worked. As a result, many industries remained in Manhattan while their workers moved to other boroughs, and later still to the more distant suburbs. As a result, the population densities of Manhattan today are more consistent from one end of the island to the other. Unlike in 1900, Harlem today is about as dense of the Lower East Side because transportation has made one part of the island almost as accessible to work as any other part of the island.
This animation illustrates Manhattan specifically, but Manhattan’s growth and population densities were influenced by larger population and technology changes in the New York region.

The Detroit Evolution Animation

Created in gratitude to the University of Michigan’s PhD program in architecture
Related: The New York City Evolution Animation

.

Soundtrack: “Pruitt Igoe” from Koyaanisqatsi, directed by Godfrey Reggio and composed by Philip Glass.

.

This film traces Detroit’s evolution from its origins as a French trading post in the 1700s, to its explosion as a metropolis, followed by its precipitous decline as a symbol of America’s post-industrial urban landscape. The film weaves in details about the city’s politics, population, and technology – all of which influenced the city’s geography and built environment. At each phase in urban history, the built environment grew and was modified in direct response to political events like racial segregation, population changes like the Great Migration, technology developments like the mass-produced car, and government interventions like urban renewal.
The animation tells the story of Detroit specifically and the story of American cities more broadly. To varying degrees, the path of Detroit’s development mirrors hundreds of other smaller cities and towns scattered across the American Northeast and Midwest. No other American city witnessed as large a population loss, as dramatic 1960s racial unrest, or as radical a transformation from symbol of progress into symbol of decay. To a lesser degree, other places in America followed Detroit in lockstep. Urban renewal projects, highway construction, racial tensions, suburban growth, and infrastructure under-investment happened across America, and in parallel to Detroit.
However, the most dramatic transformation of Detroit is left unwritten in this film. Beneath the surface-level events of political conflict and urban change, the largest event in Detroit is not unique to Detroit. As filmmaker Godfrey Reggio describes, the most important theme in the history of civilization is “the transiting from all nature, or the natural environment as our hosts of life for human habitation, into a technological milieu into mass technology as the environment of life.” European cities developed slowly and gradually over centuries, in the process removing all memory of the natural landscape before civilization. American cities are unique in their youth and speed of growth. They are new enough that an active memory survives through place names and written records of the landscape and indigenous peoples who lived there before colonization. As the oldest colonial settlement west of the Appalachians, and as the city that perfected the mass-produced automobile, Detroit becomes the prime symbol of man’s transformation of his home from a natural world into a technological society removed from nature.

View map bibliography and project methodology

Includes links to download all source files on which the film is based

.

The accompanying music is by composer Philip Glass and was written for Godfrey Reggio’s 1982 experimental documentary Koyaanisqatsi. The shifting layers and repetitive phrases of Glass’ music accompany Reggio’s montages of natural landscapes, factory assembly lines, and chaotic city streets. Koyaanisqatsi means “life out of balance” in the language of an indigenous American tribe called the Hopi. In the original documentary, Glass’ music was paired with scenes of desolate streets in the South Bronx, the abandoned Pruitt-Igoe public housing in St. Louis, and ruined skyscrapers falling in slow motion. In my reinterpretation of Glass’ music, the imagery is now of Detroit in maps. The pace and events in the animation are tied to the structure of the music. As the volume and speed of the music increase and decrease, so too does the growth and decline of Detroit.

View music in original context

Pruit Igoe from Koyaanisqatsi; composed by Philip Glass with images by Godfrey Reggio

.

Population Changes to Detroit Over Time

Hover over infographic for details of each census year.

.

The influx of Black people during the Great Migration and the outflow of cars from Detroit’s factories reshaped the city’s built environment and the American public’s perception of Detroit. Detroit is now thought of as a majority-Black city surrounded by majority-White suburbs. Today, 83% of Detroit’s population is Black, and only 11% is White. But the graph above shows that Detroit was majority-White until the 1980 census. For most of its history, Detroit was 95 to 99% White. Today, the majority of the metro region’s population lives in the suburbs that surround Detroit. But until the 1960 census, the majority of the population lived within the city limits. Today, Detroit is so reliant on the car that it has no commuter rail network, no subways, and limited public transportation options. But until the 1950s demolition of Detroit’s light rail network, a majority of residents lived within walking distance of a light rail station for commuting. Detroit’s demographics, suburban sprawl, and transportation options have all flipped in the past century. From a high-density, transportation rich, and majority-White city in 1920, Detroit has become a low-density, transportation poor, and majority-Black city in 2020.
A lot of people say Detroit has terrible public transit design. But from the perspective of car companies, the real estate lobby, and fearful Whites, the system does exactly what it was intended to do: to segregate and divide our country by covert means long after Jim Crow officially “ended.” Failure by design. The failure of Detroit is, in large part, planned and a consequence of government policy decisions that: prioritize suburban growth over urban development; benefit suburban Whites over urban Blacks; and encourage private cars at the expense of public transit.
As the Detroit Evolution Animation plays, the map key on the lower right hand corner indicates Detroit’s demographics at each decade in history. Try to link changes to demographics with changes to the urban form. Ask yourself the questions: How were technology, transportation, and demographic changes imprinted on the built environment? How does the built environment, in turn, shape urban and suburban life?

.

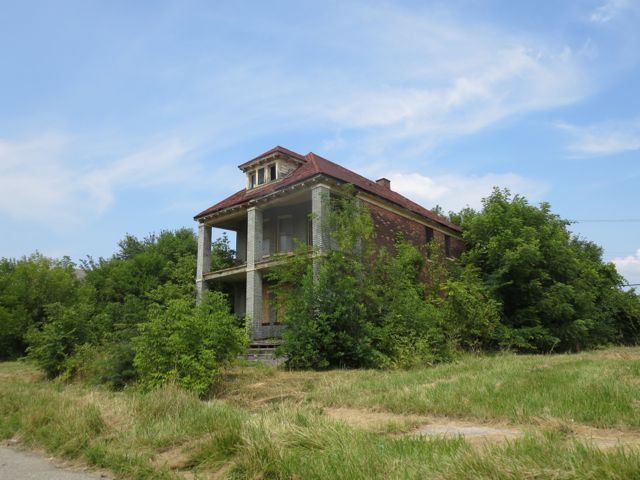
Decaying home near Detroit’s abandoned Packard Automotive Plant

Notre-Dame of Paris Construction Sequence

Created with architectural historian Stephen Murray
As featured in:
1. Notre Dame’s official website
2. Open Culture, May 2021
2. Rebuilding a Legacy, hosted April 2021 by the French Embassy, view recording
3. Restoring a Gothic Masterpiece, hosted May 2021 by the Los Angeles World Affairs Council and Town Hall, view recording
4. Visual investigations of architecture by the French daily paper, Le Monde, December 2024, view film

.

1. Construction time-lapse

This construction time-lapse illustrates the history of Notre-Dame from c.1060 to the present day, following ten centuries of construction and reconstruction. Model is based on actual measurements of the cathedral and was peer reviewed for accuracy by scholars at Columbia University’s art history department and at the Friends of Notre-Dame of Paris.
The film was created in the computer modeling software SketchUp, based on hand-drawn image textures. The ink drawings of nineteenth-century architect Viollet-le-Duc were scanned and applied to the model surfaces, so as to transform the two-dimensional artwork into the three-dimensional digital. I believe computer models should preserve a certain handmade quality.

.

Music: Pérotin, Viderunt Omnes

View animation with music only.

Read text of Stephen Murray’s audio narration.

.

2. Virtual reality computer model

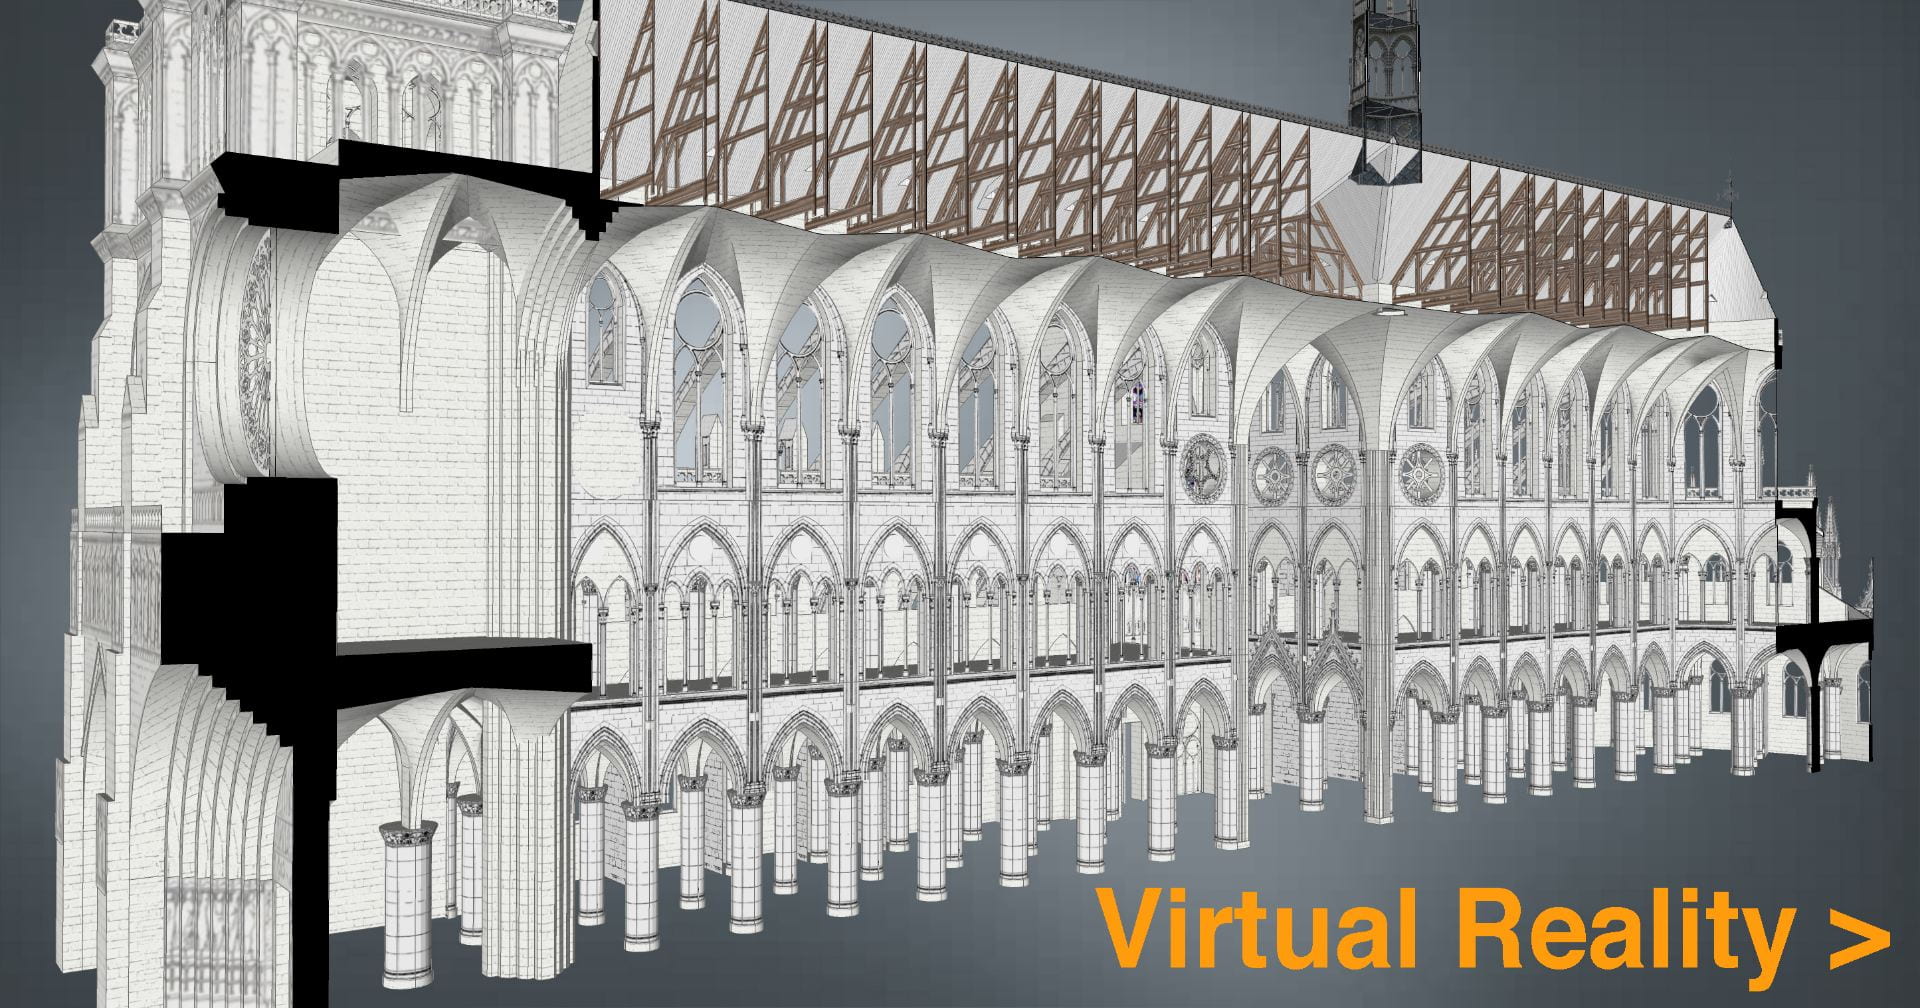
Explore the interior and exterior of Notre-Dame in virtual reality.
Give thirty seconds for browser to load. Link opens in new window.
Complete model of Notre-Dame inside and out. Download includes simulation of cathedral construction sequence.

.

.

Fire on 15 April 2019

.

3. Research method and work flow

Learn how this model was created – and how to create similar models of your own – with my series of online tutorials shared to this page.

.

4. Computer model and construction sequence sources

– Dany Sandron and Andrew Tallon. Notre-Dame Cathedral: nine centuries of history.
– Eugène Viollet-le-Duc. Drawings of Notre-Dame. From Wikimedia Commons.
J. Clemente. Spire of Notre-Dame. From SketchUp 3D Warehouse.
– Eugène Viollet-le-Duc and Ferdinand de Guilhermy. Notre-Dame de Paris. From BnF Gallica.
– Caroline Bruzelius. “The Construction of Notre-Dame in Paris” in The Art Bulletin. From JSTOR.
– Michael Davis. “Splendor and Peril: The Cathedral of Paris” in The Art Bulletin. From JSTOR.

.

5. Exterior still images from model

.

.

6. Interior still images

.

.

7. Dynamic angles

.

Homesteads to Homelots

The history of New Jersey suburbs as told through five data visualizations

.

View of the city from the suburbs, author’s panoramic drawing of suburbs with urban skyline in the distance

.

“The state of New Jersey offers an ideal setting in which to analyze the distinctive residential landscape of mass suburbia. [….] In time, 70 percent of the state’s total land area would qualify as suburban, so that by the turn of the twenty-first century New Jersey and Connecticut shared the distinction of being the nation’s most suburbanized states.”

.

– Lizabeth Cohen, “Residence: Inequality in Mass Suburbia” in A Consumer’s Republic, p. 197.

.

Northern New Jersey has long been central to the history of America’s suburban growth. From America’s oldest suburban developments to its most homogeneous to its most diverse, New Jersey’s 565 municipalities span the full portfolio of suburban living arrangements. New Jersey is unique in the sheer number of municipalities, each with its own elected leaders, school district, police, fire, and land use policies. As a result of inefficient and often duplicate public services in competing suburbs, New Jersey has some of the highest property taxes and cost of living in the country. This problem is not unique to New Jersey; it affects the country at large in dozens of other places. So the story of New Jersey makes for a powerful and revealing case study of larger trends in American suburban history.
This analysis examines New Jersey census data from 1940 to 2010. It is not the end point or a full analysis. Instead, each of these data visualizations plots a direction for future research. Telling history through maps and data reveals the history of a larger region and country, in ways that granular analysis of individual places cannot.

.

Method

With data from the US Census Bureau, I extracted details on the population of every New Jersey municipality from 1940 to 2010, the period of greatest suburban growth. With spatial data on municipal boundaries from the NJ Office of GIS, I plotted the census data onto the map of municipal boundaries. This allowed me to see spatial patterns and to produce heat maps of population change over time. The spatial data also revealed the surface area of each municipality, which allowed me to calculate the historical population density of each municipality as a function of municipal population divided by municipal surface area. You can browse all the data visualizations or download the open source data here from Tableau. These data visualizations represent analysis of about 13,560 data points for 565 municipalities over eight censuses.

Read More

.

St. Paul’s Cathedral Dome: a synthesis of engineering and art

Developed with James Campbell, architectural historian at the University of Cambridge
Inspired by taking George Deodatis’ lectures on The Art of Structural Design
at Columbia University’s Department of Civil Engineering

.

In 1872, Eugène-Emmanuel Viollet-le-Duc, the French author and architect celebrated for restoring Notre-Dame of Paris, wrote in his Lectures on Architecture that the form of the Gothic cathedral was the synthesis of the early Christian basilica and the Romanesque three-aisled church. In this analysis, Viollet-le-Duc reasoned that a thesis (early Christian) plus an antithesis (Romanesque) produced the synthesis (Gothic).

.

Animation from Stephen Murray

Although the history and origins of Gothic are more complex than Viollet-le-Duc’s formula, this formula provides a method to dissect the Renaissance and Enlightenment counterpart to the medieval cathedral: the Greco-Roman basilica, as embodied by St. Paul’s Cathedral, constructed from 1675 to 1711 by Christopher Wren (1632-1723). St Paul’s is a symbol of Enlightenment-era London, built to rival its medieval counterpart of Westminster Abbey.
In this essay, and in my analysis of this neoclassical cathedral, I will parallel Viollet-le-Duc’s analysis of the medieval church. The thesis is that St. Paul’s is a work of techno-scientific engineering. The antithesis is that this building is a work of art that speaks to the larger cultural moment of Enlightenment London. The synthesis is the dome of St. Paul’s that merges these two forces of engineering and art into a unified and impressive creation.

.

Thesis: ENGINEERING
The engineering of this dome is more complex than meets the eye.

In this animated construction sequence, view how the dome was engineered.

.

Music from the organ (William Tell’s Overture) and bells of St Paul’s (recorded 2013)

.

St. Paul’s Cathedral features an innovative triple dome structure. On the circular drum, the inner dome rises and is visible from the cathedral interior. Above this inner dome, a brick cone rises to support the 850 ton lantern. This brick cone also supports the wood rafters and frame of the outer dome, which is covered in wood and lead. This three dome system allows the cathedral to support such a heavy lantern, all the while maintaining the great height needed to be a visible London landmark.
  • Inner dome – visible from inside and purely for show; height 225 ft (69m)
  • Middle brick cone – a brick cone that is invisible from below but supports the 850 ton lantern above; height 278 ft (85m)
  • Outer dome – a wood and lead-roofed structure visible from the cathedral exterior; height 278 ft (85m)
  • Lantern – an 850 ton stone lantern and cross, whose weight is carried to the ground via the middle brick cone 365ft (111m)
The inner and outer domes are decorative, while the brick cone is the true weight-bearing support. The model below is created from measured plans and is accurate to reality.

Read More

.

Virtual Reality Model
(click to play)

.

.

Eastern State Penitentiary: Decorative Fortress

Developed with Max Sternberg, historian at the University of Cambridge

.

Presentation

Paper delivered 6 March 2020 at the University of Cambridge: Department of Architecture
As part of my Master’s thesis in Architecture and Urban Studies


.

.


Digital Reconstruction

Created in SketchUp. Based on original drawings and plans of the prison.
All measurements are accurate to reality.

.

With ambient music from Freesound

.

Eastern State Penitentiary was completed in 1829 in northwest Philadelphia, Pennsylvania by architect John Haviland. It was reported as the most expensive and largest structure yet built in America.
The design featured a central guard tower from which seven cell blocks radiated like a star. This system allowed a single guard to survey all prisoners in one sweep of the eye. A square perimeter wall surrounded the entire complex – thirty feet high and twelve feet thick. The decorative entrance resembled a medieval castle, to strike fear of prison into those passing. This castle contained the prison administration, hospital, and warden’s apartment.
As we approach the central tower, we see two kinds of cells. The first three cell blocks were one story. The last four cell blocks were two stories. Here we see the view from the guard tower, over the cell block roofs and over the exercise yards between cell blocks. Each cell had running water, heating, and space for the prisoner to work. Several hundred prisoners lived in absolute solitary confinement. A vaulted and cathedral-like corridor ran down the middle of each cell block. The cells on either side were stacked one above the other. Cells on the lower floor had individual exercise yards, for use one hour per day. John Haviland was inspired by Jeremy Bentham’s panopticon. (Don’t know what the panopticon is? Click here for my explanation.)
Over its century in use, thousands visited and admired this design. An estimated 300 prisons around the world follow this model – making Eastern State the most influential prison ever designed.

.

360° panoramic view from guard tower

.

Computer Model

Shows prison as it appeared in the period 1836 to 1877 before later construction obstructed the original buildings.

.

.

Research Paper

Eastern State Penitentiary’s exterior resembles a medieval castle. More than a random choice, the qualities of Gothic attempt to reflect, or fall short of reflecting, the practices of detention and isolation within. Contrary to the claim often made about this structure that the appearance was supposed to strike fear into passerby, the use of Gothic is in many ways unexpected because of its untoward associations with darkness and torture, which the prison’s founders were working to abolish. It is therefore surprising that America’s largest and most modern prison should evoke the cruelties and injustices of the medieval period. The choice of Gothic appearance, and the vast funds expended on the external appearance few inmates would have seen, leads one to question the audience of viewers this penitentiary was intended for – the inmates within or the public at large?
This essay responds by analyzing what the Gothic style represented to the founders. The architectural evocation of cruelty and oppression was, in fact, not contradictory with the builders’ progressive intentions of reforming and educating inmates. This prison’s appearance complicates our understanding of confinement’s purpose in society. The two audiences of convicted inmates and tourist visitors would have received and experienced this prison differently, thereby arriving at alternative, even divergent, understandings of what this prison meant. More than an analysis of the architect John Haviland and of the building’s formal qualities in isolation, this essay situates this prison in the larger context of Philadelphia’s built environment.

.

Acknowledgements

I am indebted to my supervisor Max Sternberg, to my baby bulldog, and to my ever-loving parents for criticizing and guiding this paper.

.

Continue reading paper.

Opens in new window as PDF file.

.

.

Related Projects

Master’s thesis on this prison
Animation of Jeremy Bentham’s panopticon
Computer model of panopticon in virtual reality
Lecture on problems with the panopticon

The Berlin Evolution Animation

Abstract: The Berlin Evolution Animation visualizes the development of this city’s street network and infrastructure from 1415 to the present-day, using an overlay of historic maps. The resulting short film presents a series of 17 “cartographic snapshots” of the urban area at intervals of every 30-40 years. This process highlights Berlin’s urban development over 600 years, the rapid explosion of industry and population in the nineteenth-century, followed by the destruction and violence of two world wars and then the Cold War on Berlin’s urban fabric.

.

.

.

Animation der Wandlung Berlins

Zusammenfassung: Auf der Grundlage von historischen Karten visualisiert die „Animation der Wandelung Berlins“ die Entwicklung des Straßennetzwerks und der Infrastruktur Berlins von 1415 bis heute. In diesem kurzen Video wird eine Serie von 17 „kartographischen Momentaufnahmen“ der Stadt in einem Intervall von 30 – 40 Jahren präsentiert. Dadurch wird die Entwicklung der Stadt Berlin über 600 Jahre, das rapide Wachstum der Industrie und Bevölkerung im 19. Jahrhundert, die Zerstörung und Gewalt der zwei Weltkriege und abschließend des Kalten Krieges auf Berlins Stadtbild verdeutlicht.

German translations by Richard Zhou and Carl von Hardenberg

.

Year, Event and Estimated Population
1415 – Medieval Berlin – 7,000
1648 – Thirty Years War – 6,000
1688 – Berlin Fortress – 19,000
1720 – Rise of Prussian Empire – 65,000
1740 – War with Austria – 90,000
1786 – Age of Enlightenment – 147,000
1806 – Napoleonic Wars – 155,000
1840 – Industrial Revolution – 329,000
1875 – German Empire – 967,000
1920 – Greater Berlin – 3,879,000
1932 – Rise of Fascism – 4,274,000
1945 – Extent of Bomb Damage – 2,807,000
1950 – Germania – World Capital
1953 – Recovery from War – 3,367,000
1961 – Berlin Wall – 3,253,000
1988 – A City Divided – 3,353,000
Contemporary – A City United
Census year
Jahr, Ereignis und geschätzte Anzahl von Bewohnern
1415 – Berlin im Mittelalter – 7,000
1648 – Der Dreißigjährige Krieg – 6.000
1688 – Die Festung Berlin – 19.000
1720 – Der Aufstieg des Königreichs Preußen – 65,000
1740 – Der Österreichische Erbfolgekrieg – 90.000
1786 – Das Zeitalter der Aufklärung – 147.000
1806 – Die Koalitionskriege – 155.000
1840 – Die industrielle Revolution – 329.000
1875 – Das Deutsche Kaiserreich – 967.000
1920 – Groß-Berlin – 3.879.000
1932 – Der Aufstieg des Faschismus – 4.274.000
1945 – Die Spuren des 2. Weltkrieges – 2.807.000
1950 – Germania – Welthauptstadt
1953 – Deutsches Wirtschaftswunder – 3.367.000
1961 – Die Berliner Mauer – 3.253.000
1988 – Eine geteilte Stadt – 3.353.000
Heute – Eine wiedervereinte Stadt
Jahr der Volkszählung

.

Methodology and Sources

I chose not to represent urban development before 1415 for three reasons: Firstly, there are too few accurate maps of the city before this time. Secondly, I needed to find accurate maps that had visual style consistent with later years, to enable easier comparison of development over time. Thirdly, the extent of urban development and population is limited (fewer than 10,000 Berliners).
There are numerous maps showing Berlin’s urban growth. Yet, few of them are drawn to the same scale, orientation and color palette. This makes it more difficult to observe changes to the city form over time. Fortunately, three map resources show this development with consistent style.
  1. The Historischer Atlas von Berlin (by Johann Marius Friedrich Schmidt) published 1835 represents Berlin in the selected years of: 1415, 1648, 1688, 1720, 1740, 1786. This atlas is available, free to view and download, at this link.
  2. After the year 1786, I rely on three books from cartographer Gerd Gauglitz:
    Berlin – Geschichte des Stadtgebietsin vier Karten
    Contains four maps of Berlin from 1806, 1920, 1988 and 2020. Read article.
    Berlin – Vier Stadtpläne im Vergleich
    Contains four maps from 1742, 1875, 1932 and 2017. Read article.
    Berlin – Vier Stadtpläne im VergleichErgänzungspläne
    Contains four maps from 1840,1953, 1988 and 1950. The last map from 1950 is speculative and shows Berlin as it would have looked had Germany won WWII and executed Albert Speer’s plans for rebuilding the city, named “Germania.” Read article.
    Gerd Gaulitz’s three map books can be purchased from Schropp Land & Karte.
  3. I also show the estimated extent of WWII bomb damage to Berlin. This map is sourced from an infographic dated 8 May 2015 in the Berliner Morgenpost. View original infographic. This infographic is, in turn, based on bombing maps produced by the British Royal Air Force during WWII (and Albert Speer’s c.1950 plan for Berlin).
Below is an interactive map I created of the Berlin Wall’s route and the four Allied occupation areas:

.

.

Population statistics in the 17 “cartographic snapshots” are estimates. The historical development of Berlin’s population is known for a few years. For other years, the population is estimated with regards to the two censuses between which the year of the “snapshot” falls.

New York City Water Supply: animated history

Developed with Gergely Baics, urban historian at Barnard College

.

New York City has some of the world’s cleanest drinking water. It is one of only a few American cities (and among those cities the largest) to supply unfiltered drinking water to nine million people. This system collects water from around 2,000 square miles of forest and farms in Upstate New York, transports this water in up to 125 miles of buried aqueducts, and delivers one billion gallons per day, enough to fill a cube ~300 feet to a side, or the volume of the Empire State Building. This is one of America’s largest and most ambitious infrastructure projects. It remains, however, invisible and taken for granted. When they drink a glass of water or wash their hands, few New Yorkers remind themselves of this marvel in civil engineering they benefit from.
This animated map illustrates the visual history of this important American infrastructure.

.

Sound of water and ambient music from Freesound

New York City is surrounded by saltwater and has few sources of natural freshwater. From the early days, settlers dug wells and used local streams. As the population grew, these sources became polluted. Water shortages allowed disease and fire to threaten the city’s future. In response, city leaders looked north, to the undeveloped forests and rivers of Upstate New York. This began the 200-year-long search for clean water for the growing city.

.

Credits

Gergely Baics – advice on GIS skills and animating water history
Kenneth T. Jackson – infrastructure history
Juan F. Martinez and Wright Kennedy – data

.

Interactive Map

I created this animation with information from New York City Open Data about the construction and location of water supply infrastructure. Aqueduct routes are traced from public satellite imagery and old maps in NYPL map archives. Thanks is also due to Juan F. Martinez, who created this visualization.
Explore water features in the interactive map below. Click color-coded features to reveal detail.

.

Watersheds   Subsurface Aqueducts   Surface Aqueducts   Water Distribution Tunnels   City Limits

.

▼ For map legend, press arrow key below.

.

Sources

.
For such an important and public infrastructure, the data about this water supply, aqueduct routes, and pumping stations is kept secret in a post 9/11 world. However, the data presented here is extracted from publicly-available sources online, and through analysis of visible infrastructure features on satellite imagery when actual vector file data or raster maps are unavailable from NYC government.
.
Contemporary Maps
NYC System and Shapefiles – Juan F. Martinez
Watershed Recreation Areas – NYC Department of Environment Protection (DEP)
General System Map – NY State Department of Environmental Conservation (DEC)
.
Historic Maps
.
Texts
Water Supply Fast Facts – NY State DEC
Encyclopedia of the City of New York – Kenneth T. Jackson
.
Animation music – Freesound
Audio narration – Myles Zhang

What’s wrong with Jeremy Bentham’s Panopticon?

Animation and research as featured by Open Culture

.

Postmodernist thinkers, like Michel Foucault, interpret Jeremy Bentham’s panopticon, invented c.1790, as a symbol for surveillance and the modern surveillance state.
This lecture is in two parts. I present a computer model of the panopticon, built according to Bentham’s instructions. I then identify design problems with the panopticon and with the symbolism people often give it.

.

Related Projects

– Computer animation of Jeremy Bentham’s panopticon
View the panopticon in virtual reality
Explore about Eastern State Penitentiary, a building inspired by Bentham

Computer Model of Jeremy Bentham’s Panopticon

Created at the University of Cambridge: Department of Architecture
As part of my Master’s thesis in Architecture and Urban Studies, as featured by:
– Special Collections department at University College London
– Open Culture
– Tomorrow City
– Aeon: a world of ideas
.
To say all in one word, it [the panopticon] will be found applicable, I think, without exception, to all establishments whatsoever, in which, within a space not too large to be covered or commanded by buildings, a number of persons are meant to be kept under inspection.
– Jeremy Bentham
.

.

Since the 1790s, Jeremy Bentham’s panopticon remains an influential building and representation of power relations. Yet no structure was ever built to the exact dimensions Bentham indicates in his panopticon letters. Seeking to translate Bentham into the digital age, I followed his directions and descriptions to construct an exact model in virtual reality. What would this building have looked like if it were built? Would it have been as all-seeing and all-powerful as Bentham claims?
Explore Bentham’s panopticon in the animation above or in virtual reality below
based on Bentham’s drawings at University College London:

.

.

c.1791 plans of panopticon, drawn by architect Willey Reveley for Jeremy Bentham

Creative Commons image credit: Bentham MS Box 119a 121, UCL Special Collections

.

Panopticon: Theory vs. Reality

Central to Bentham’s proposed building was a hierarchy of: (1) the principal guard and his family; (2) the assisting superintendents; and (3) the hundreds of inmates. The hierarchy between them mapped onto the building’s design. The panopticon thus became a spatial and visual representation of the prison’s power relations. As architectural historian Robin Evans describes: “Thus a hierarchy of three stages was designed for, a secular simile of God, angels and man.”

.

Author’s images from computer model

.

To his credit, Bentham recognized that an inspector on the ground floor could not see all inmates on the upper floors. The angle of view was too steep and obstructed by stairs and walkways. To this end, Bentham proposed that a covered inspection gallery be erected between every two floors of cells.
By proposing these three inspection galleries, Bentham addressed the problem of inspecting all inmates. However, he created a new problem: From no central point was it now be possible to see all activity, as the floor plans below show. The panoramic view below shows the superintendent’s actual field of view, from which he could see into no more than four complete cells at a time. The view from the center was not, in fact, all-seeing. Guards would have to walk a continuous circuit round-and-round, as if on a treadmill. They, too, are prisoners to the architecture.

.

.

Author’s images from computer model

.

The intervening stairwells and inspection corridors between the perimeter cells and the central tower might have allowed inspectors to see into the cells. Yet these same architectural features would also have impeded the inmates’ view toward the central rotunda. Bentham claimed this rotunda could become a chapel, and that inmates could hear the sermon and view the religious ceremonies without ever needing to leave their cells. The blinds, normally closed, could be opened up for viewing the chapel.

.

.

Bentham’s suggestion was problematic. The two cross sections above show that, although some of the inmates could see the chapel from their cells, most would be unable to do so.
In spite of all these obvious faults in panopticon design, Bentham still claimed that all inmates and activities were visible and controlled from a single central point. When the superintendent or visitor arrives, no sooner is he announced that “the whole scene opens instantaneously to his view,” Bentham wrote.

.

.

Despite Bentham’s claims to have invented a perfect and all-powerful building, the real panopticon would have been flawed were it built as this data visualization helps illustrate. Although the circular form with central tower was chosen to facilitate easier surveillance, the realities and details of this design illustrate that constant surveillance was not possible. That the British public and Parliament rejected Bentham’s twenty year effort to build a real panopticon should be no surprise.
However flawed the architecture, Bentham remained ahead of his time. He envisioned an idealistic and rational, even utopian, surveillance society. Without the necessary (digital) technology to create this society, Bentham fell back on architecture to make this society possible. The failure of this architecture and its obvious shortcomings do not invalidate Bentham’s project. Instead, these flaws with architecture indicate that Bentham envisioned an institution and society that would only become possible through new technologies invented hundreds of years later.

.

Related Projects

My computer model is available here in virtual reality.
Read my research on Eastern State Penitentiary, a radial prison descended from Bentham’s panopticon

.

.

Credits

Supervised by Max Sternberg at Cambridge, advised by Philip Schofield at UCL
The archives and publications of UCL special collections, Bentham MS Box 119a 121

Audio narration by Tamsin Morton
Audio credits from Freesound
panopticon interior ambiance
panopticon exterior ambiance
prison door closing
low-pitched bell sound
high-pitched bell sound

You may reuse content and images from this article, according to the Creative Commons license.