No comments
Abstract of my PhD Dissertation Project at University of Michigan
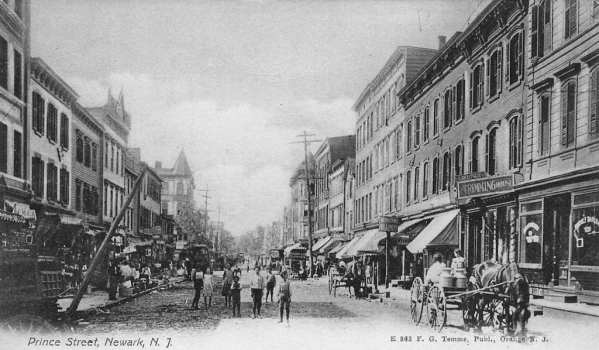
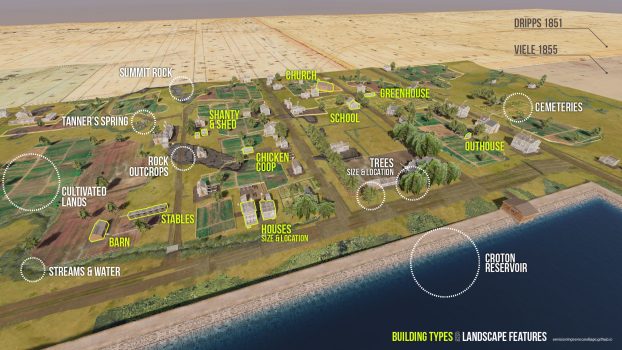
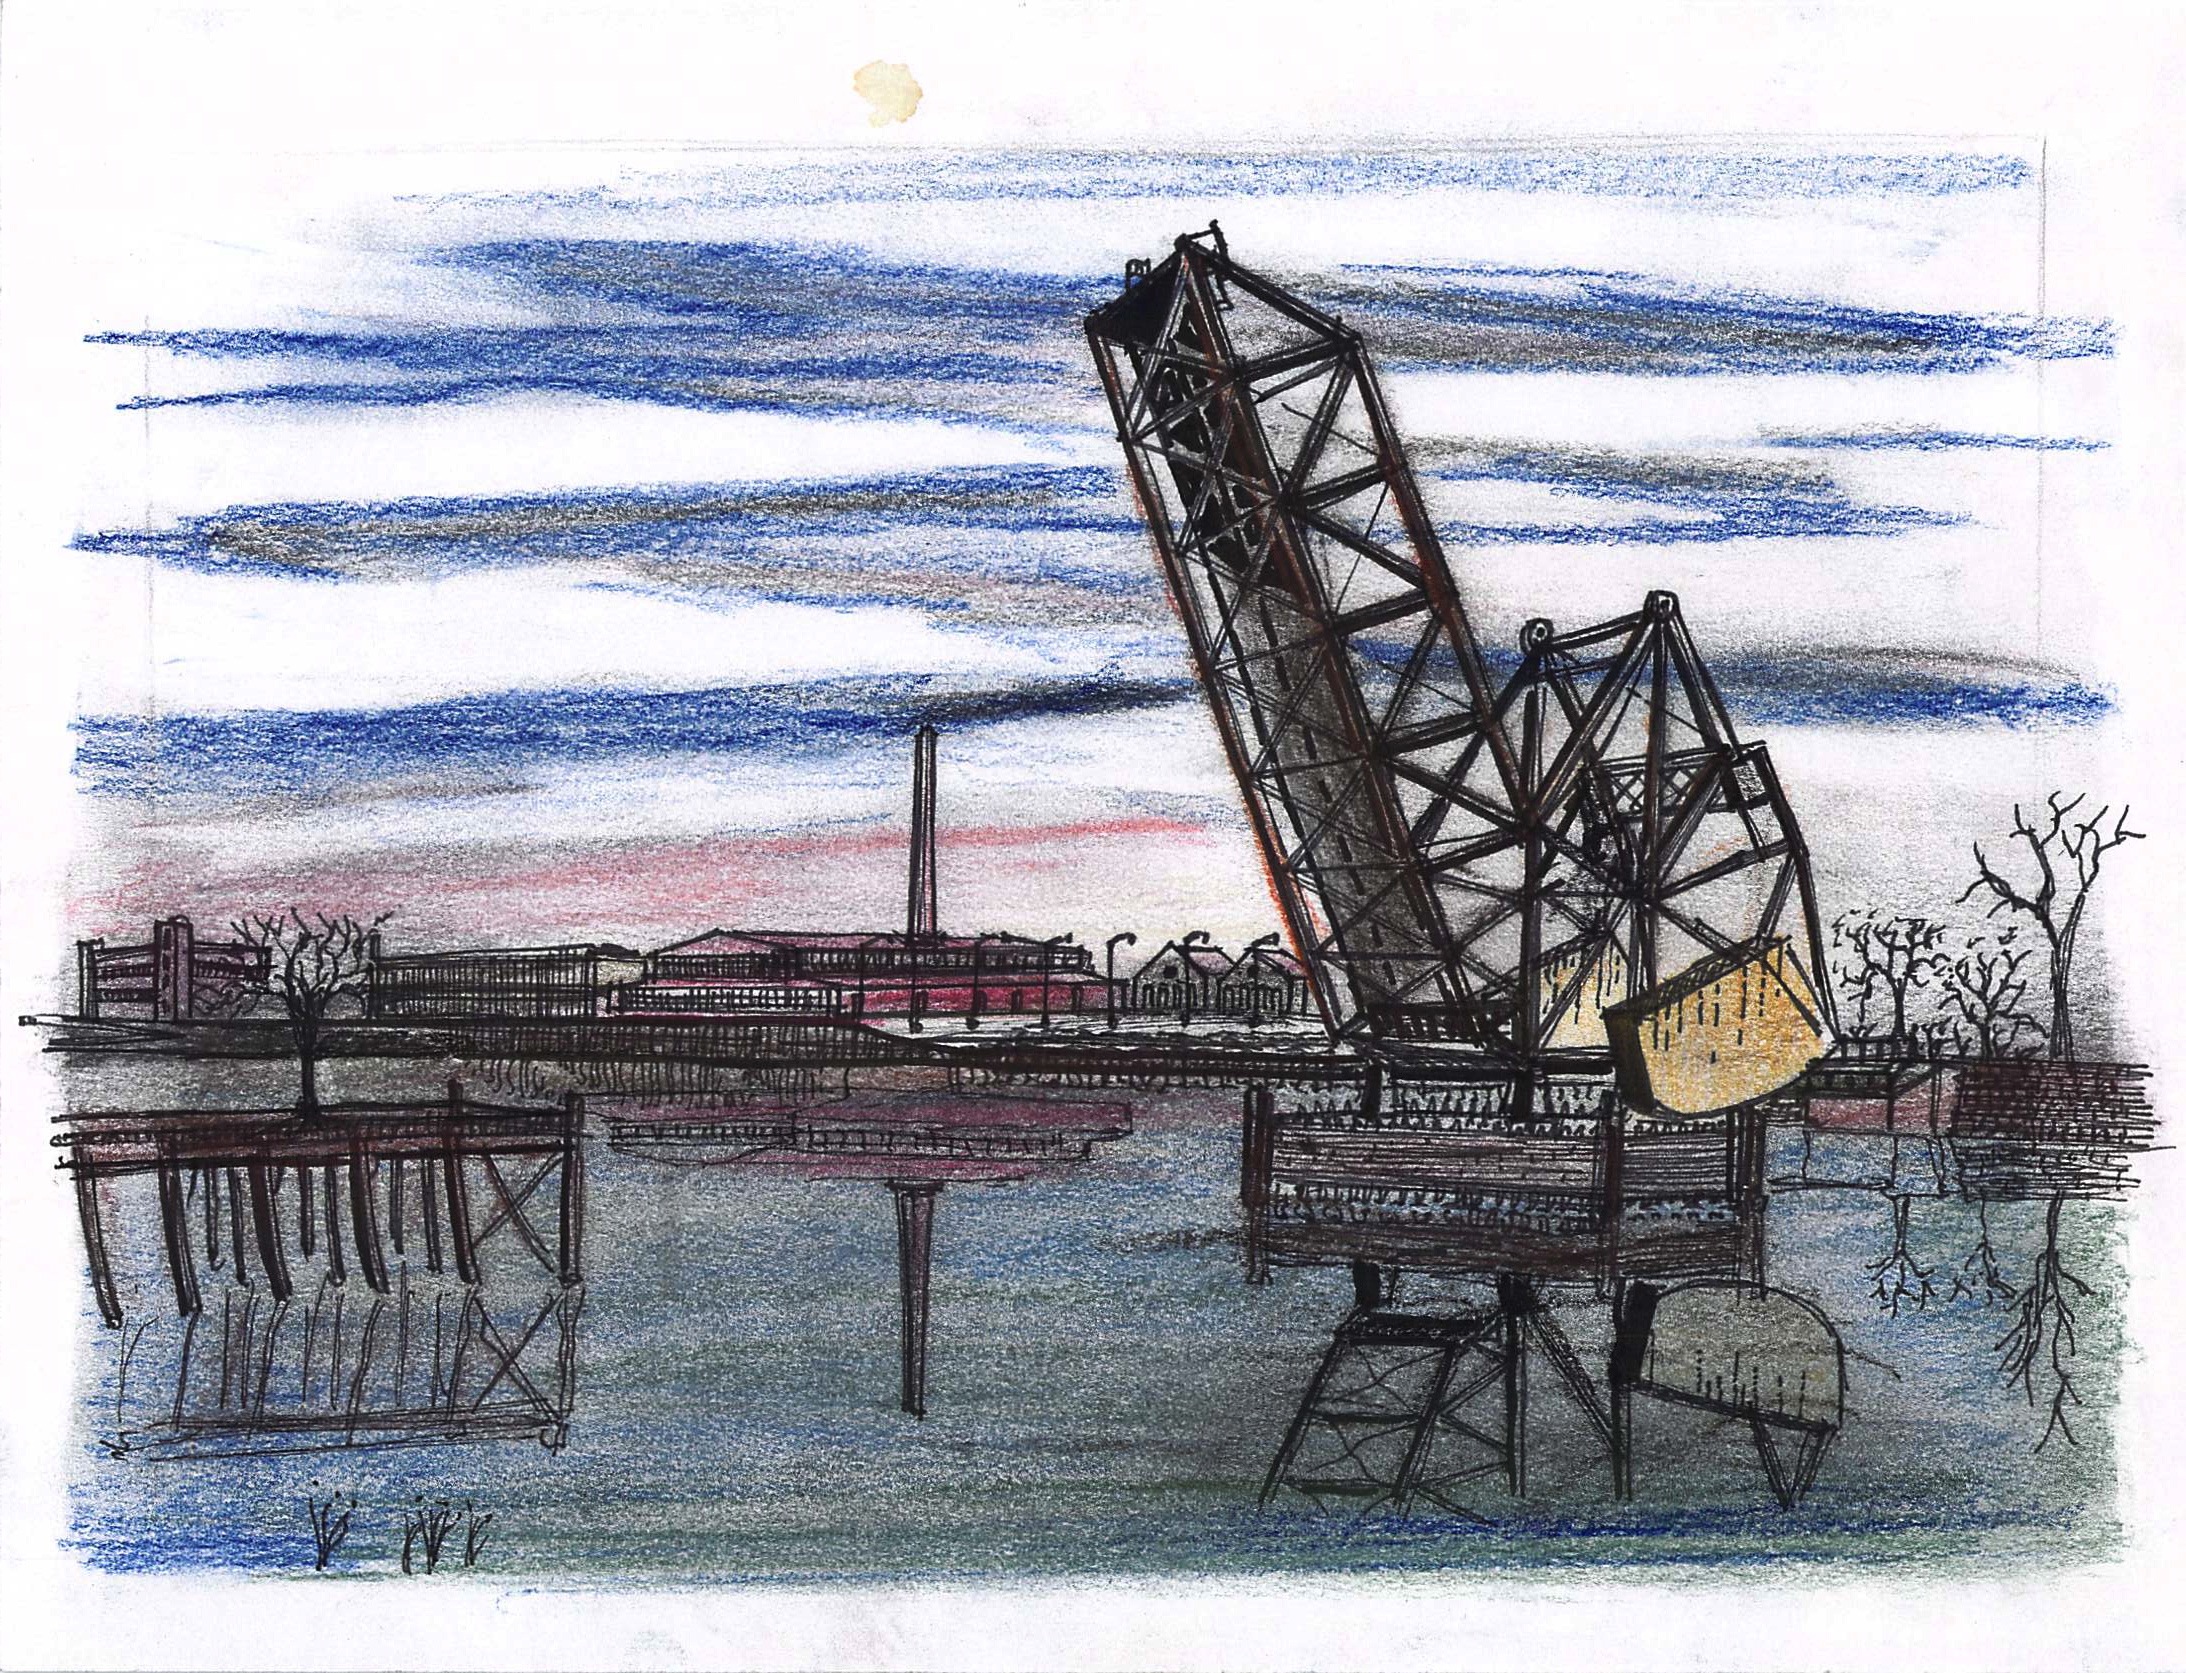
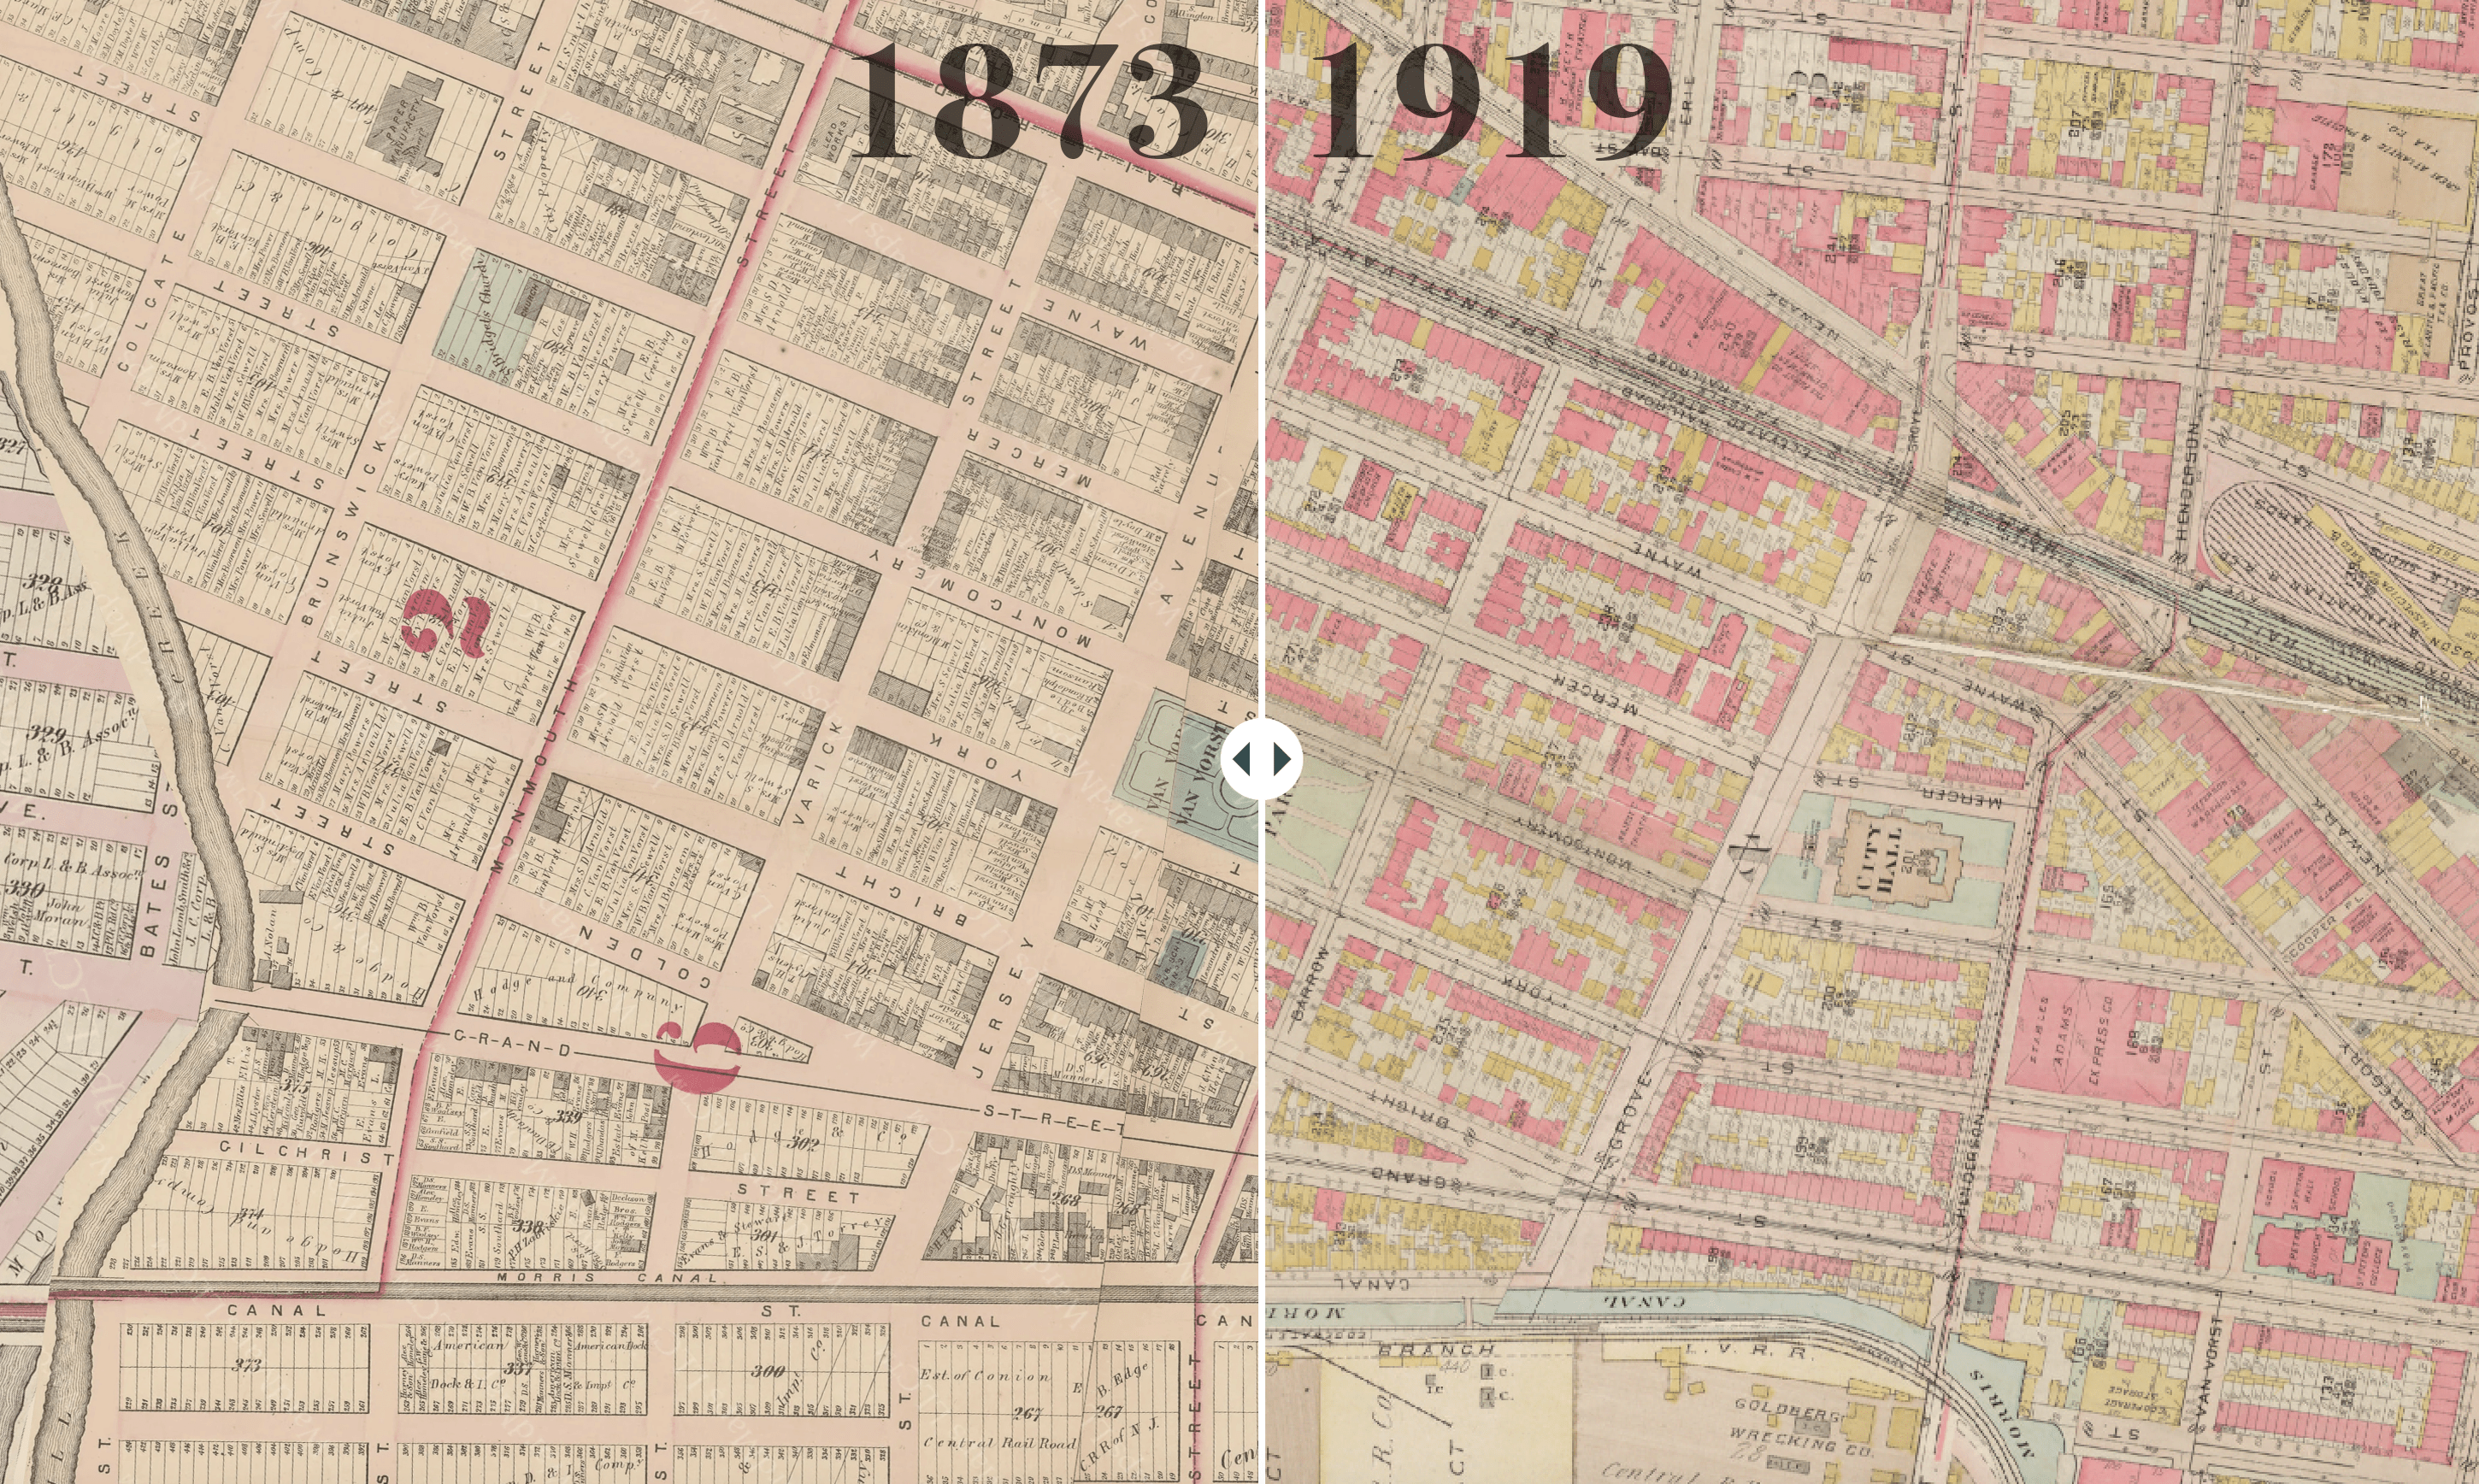
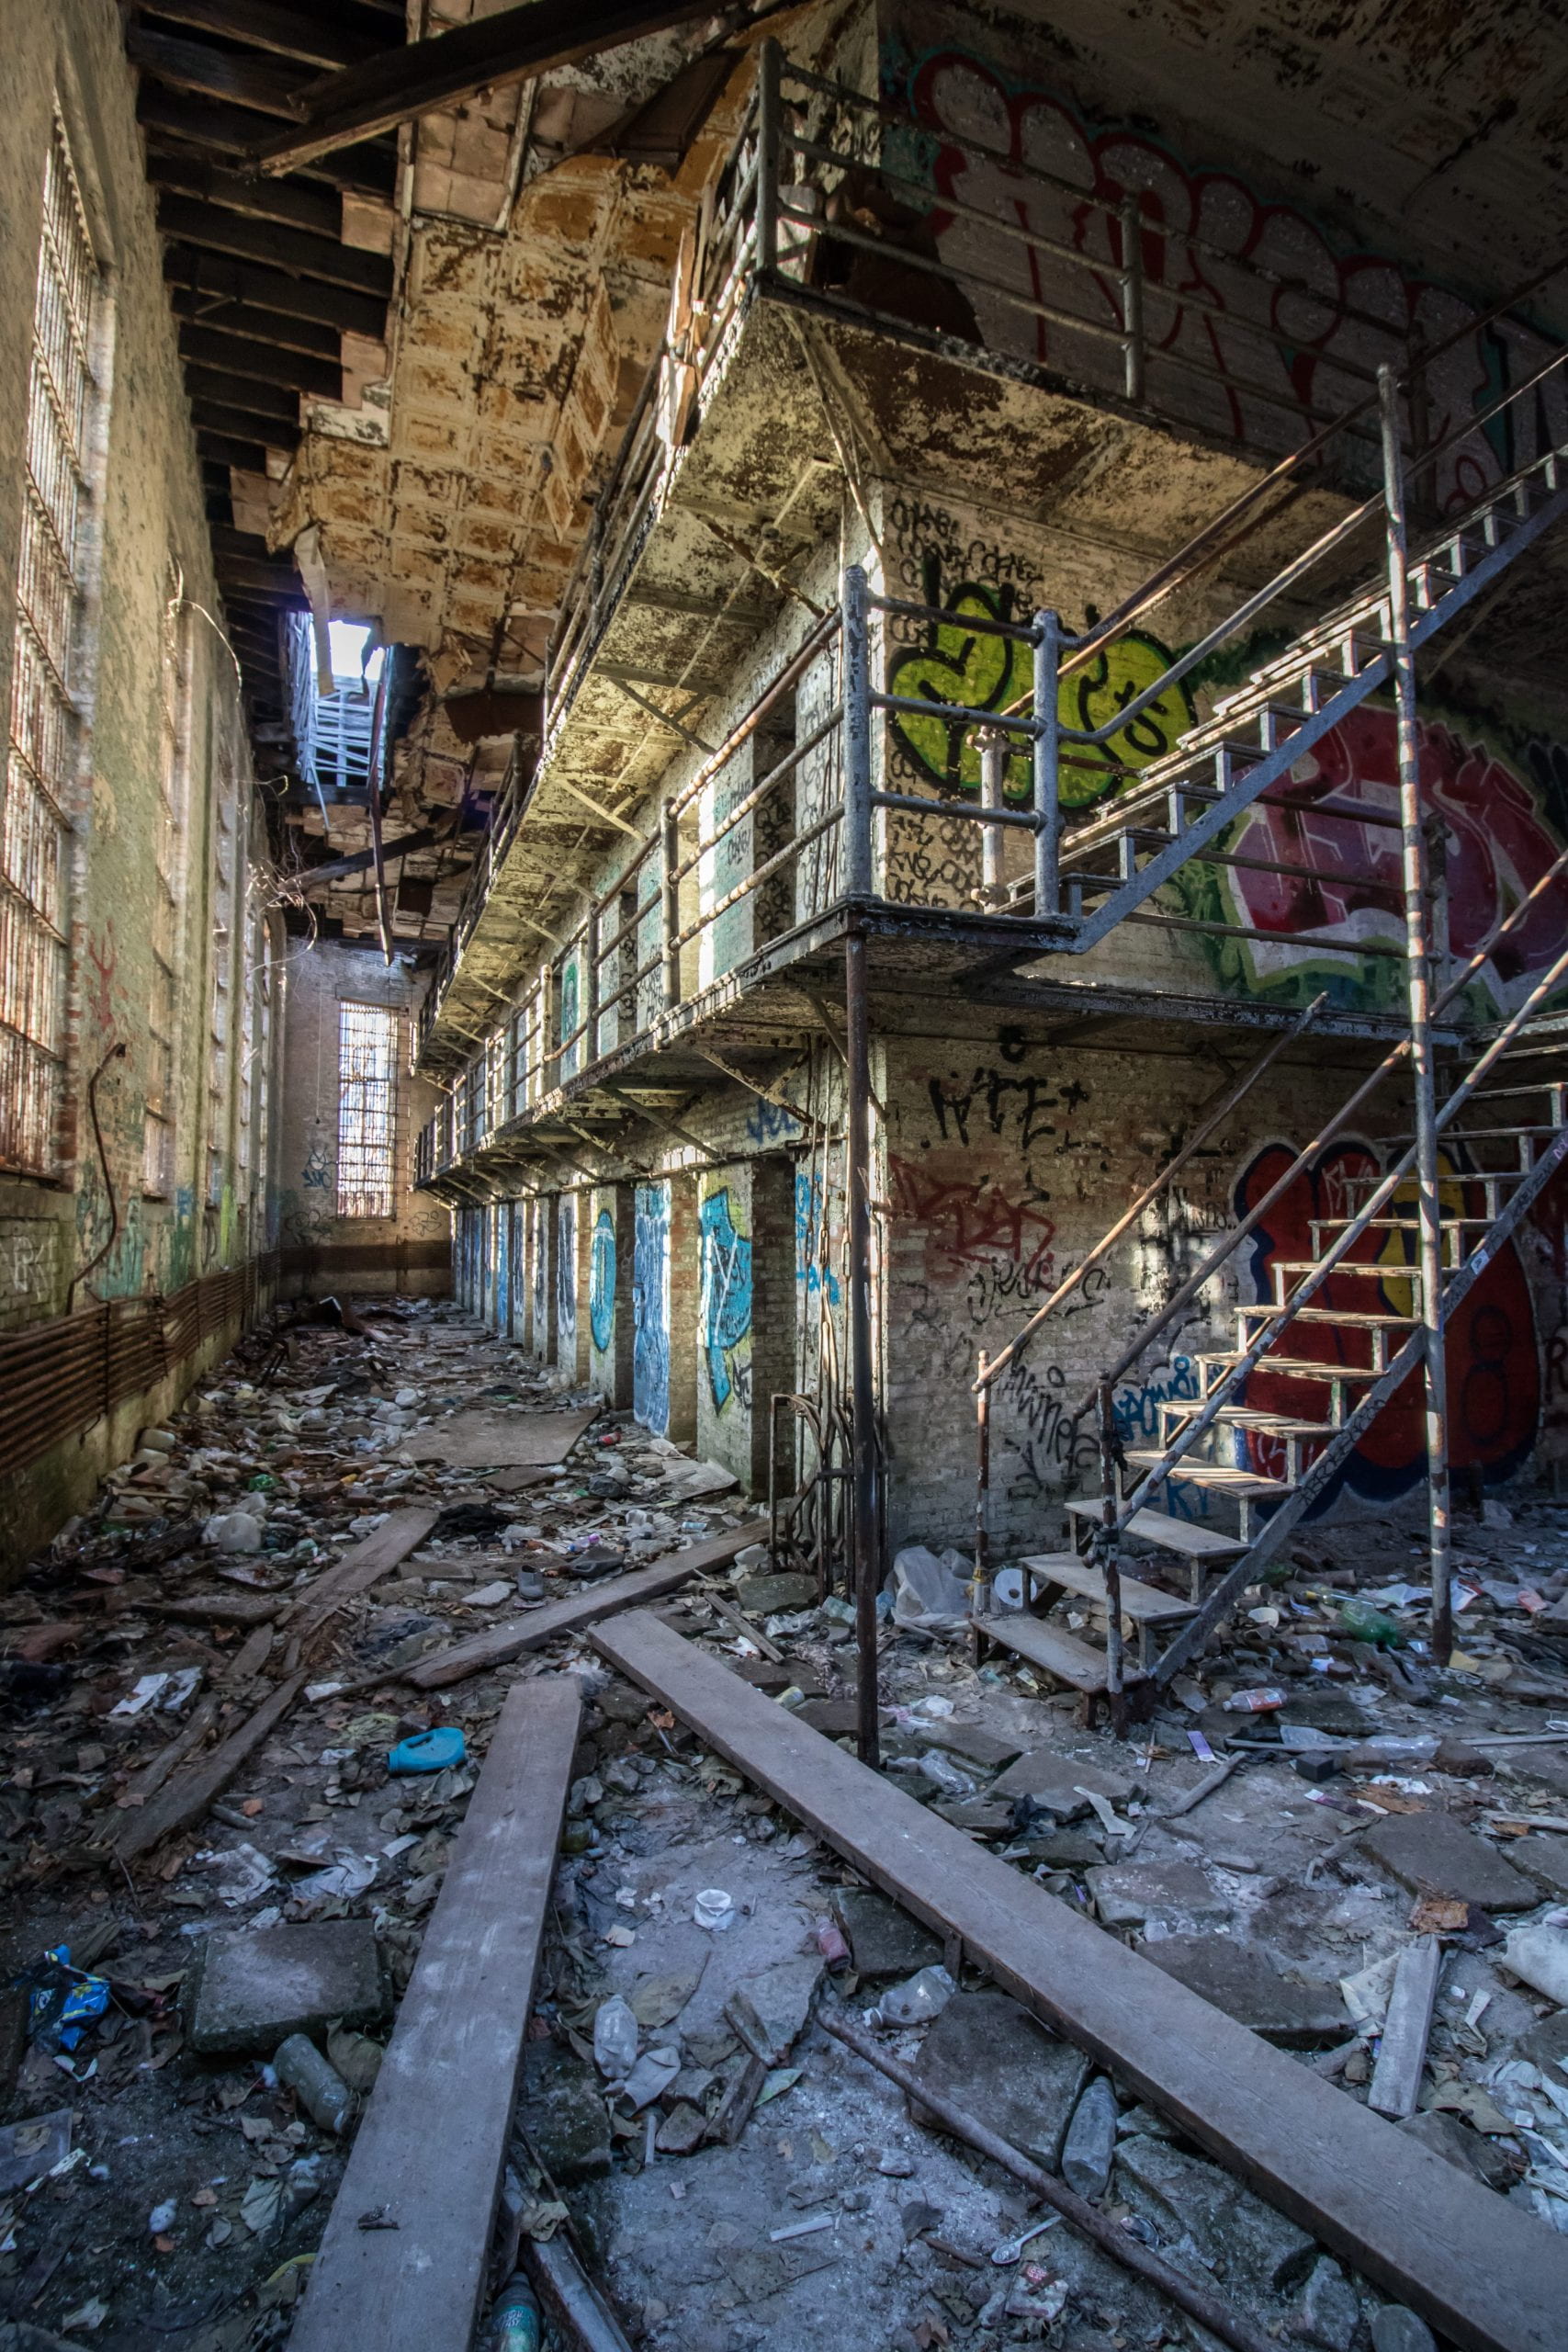
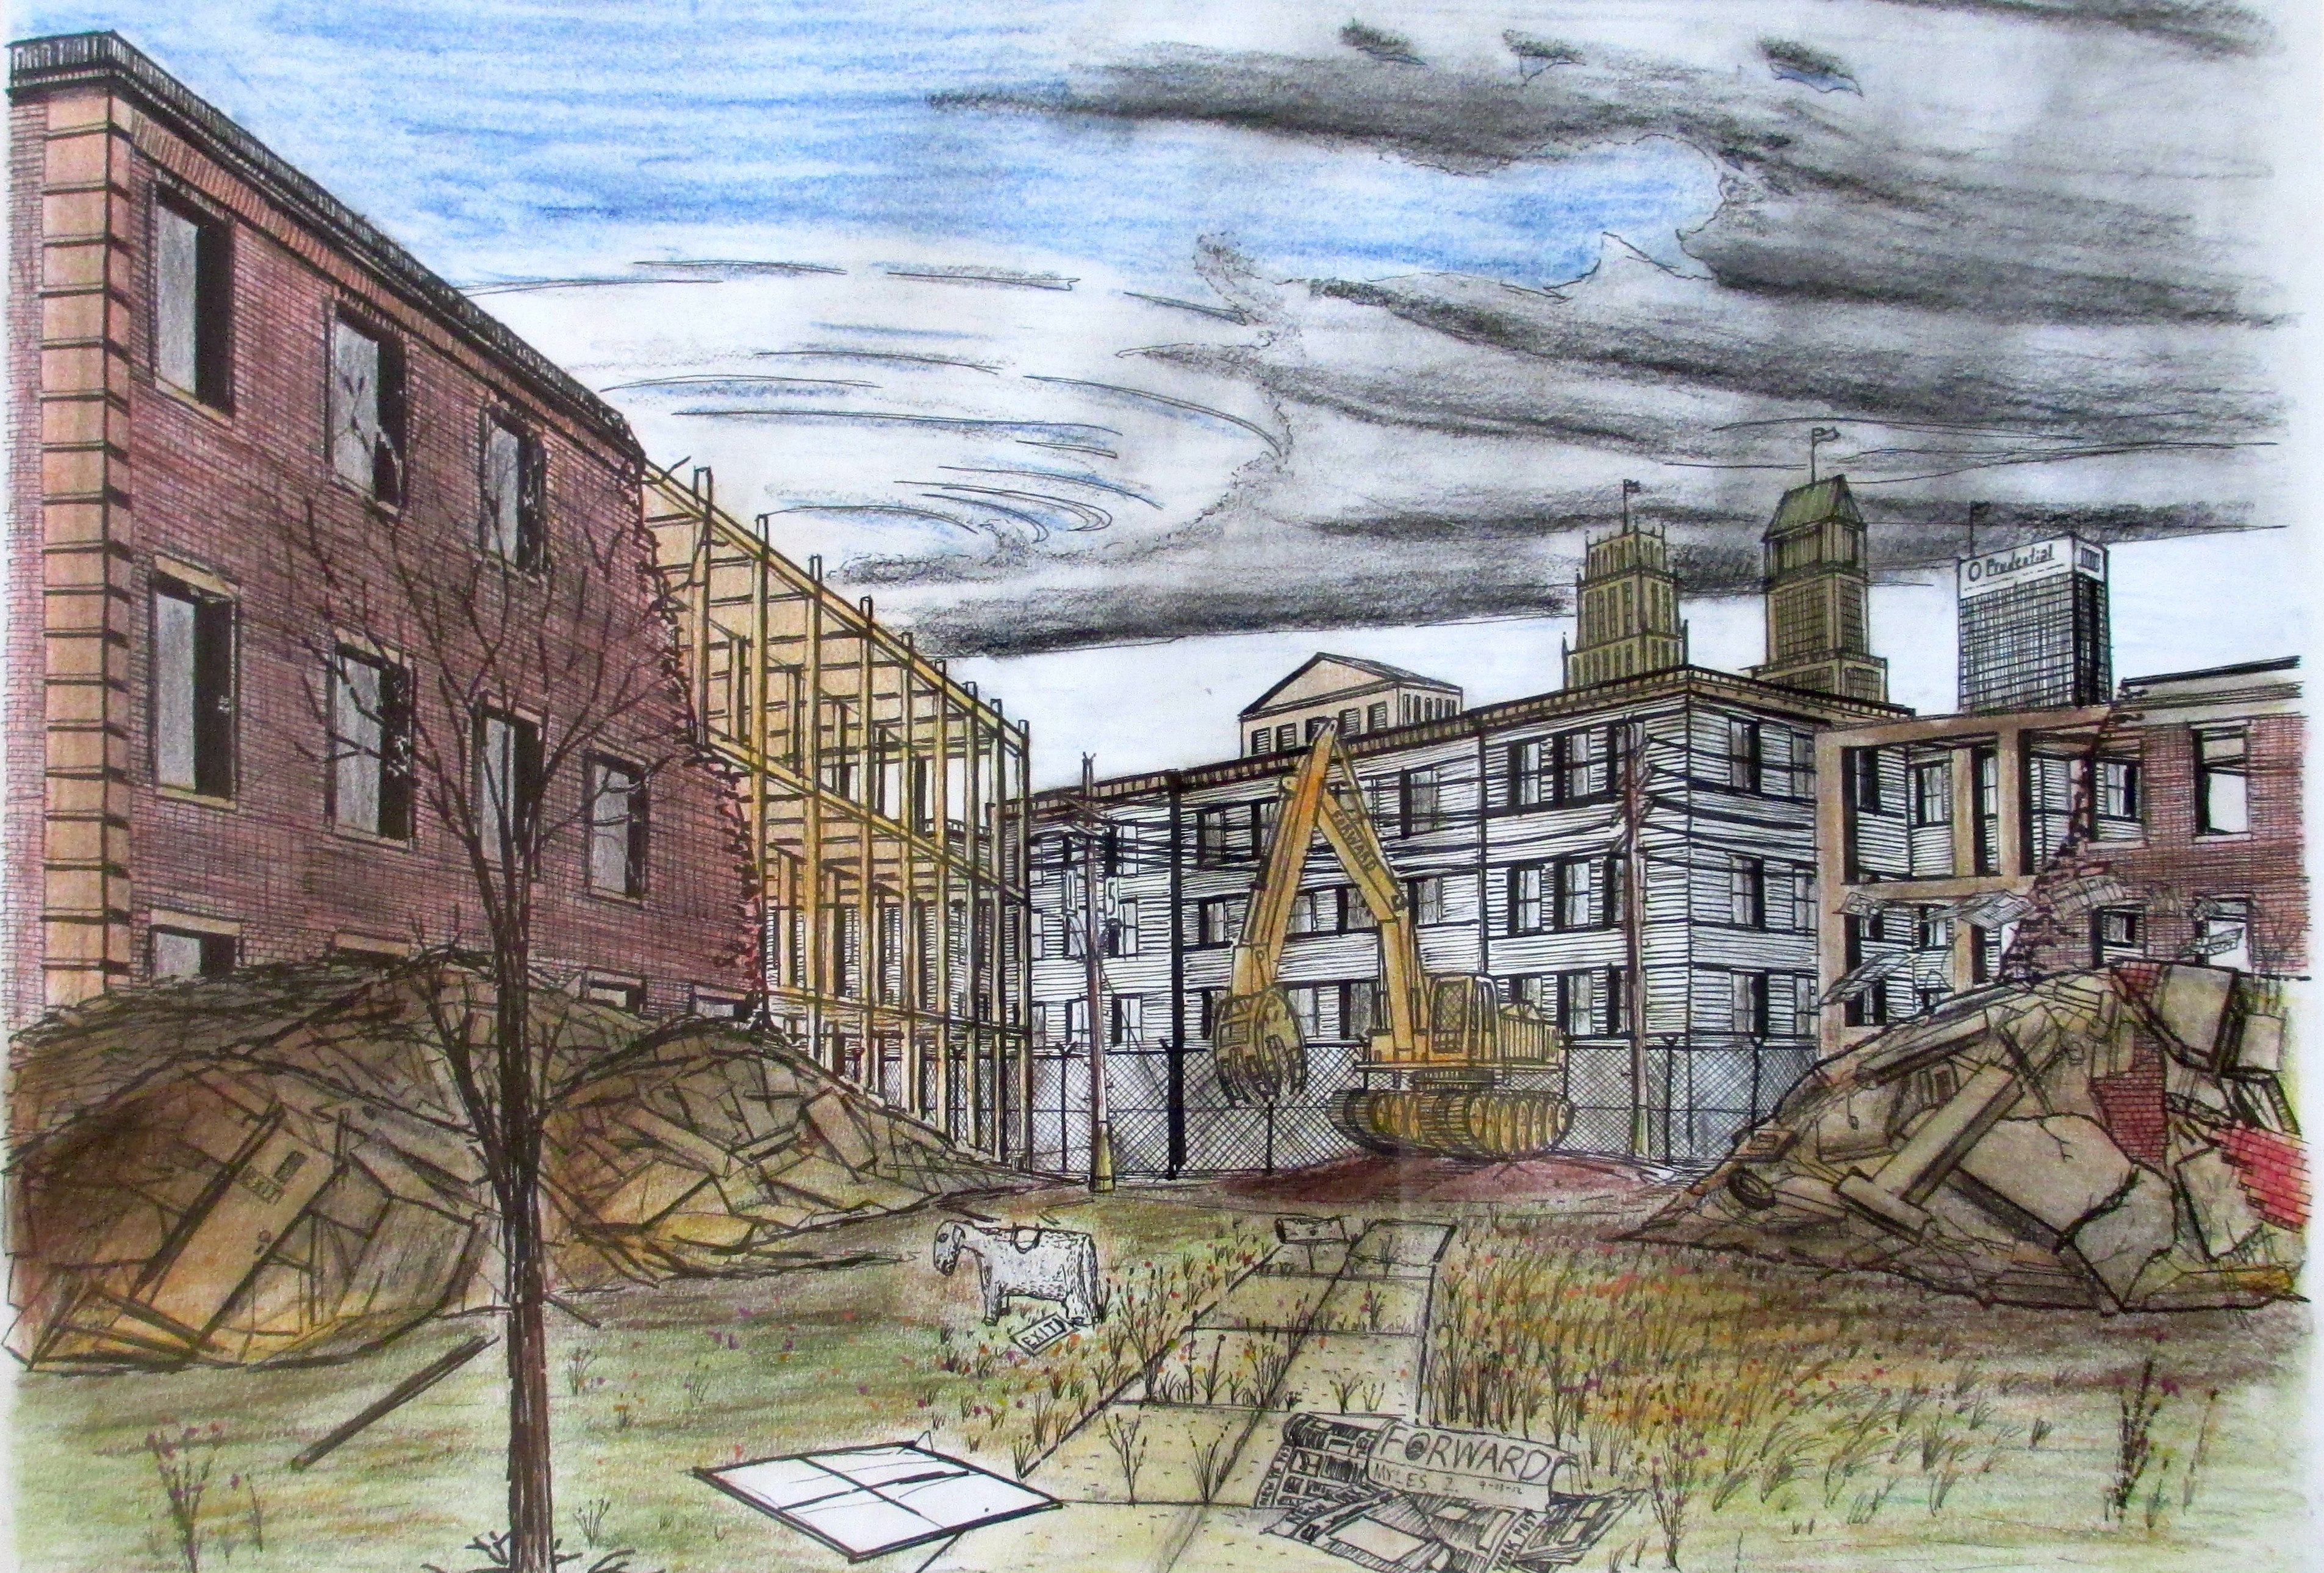
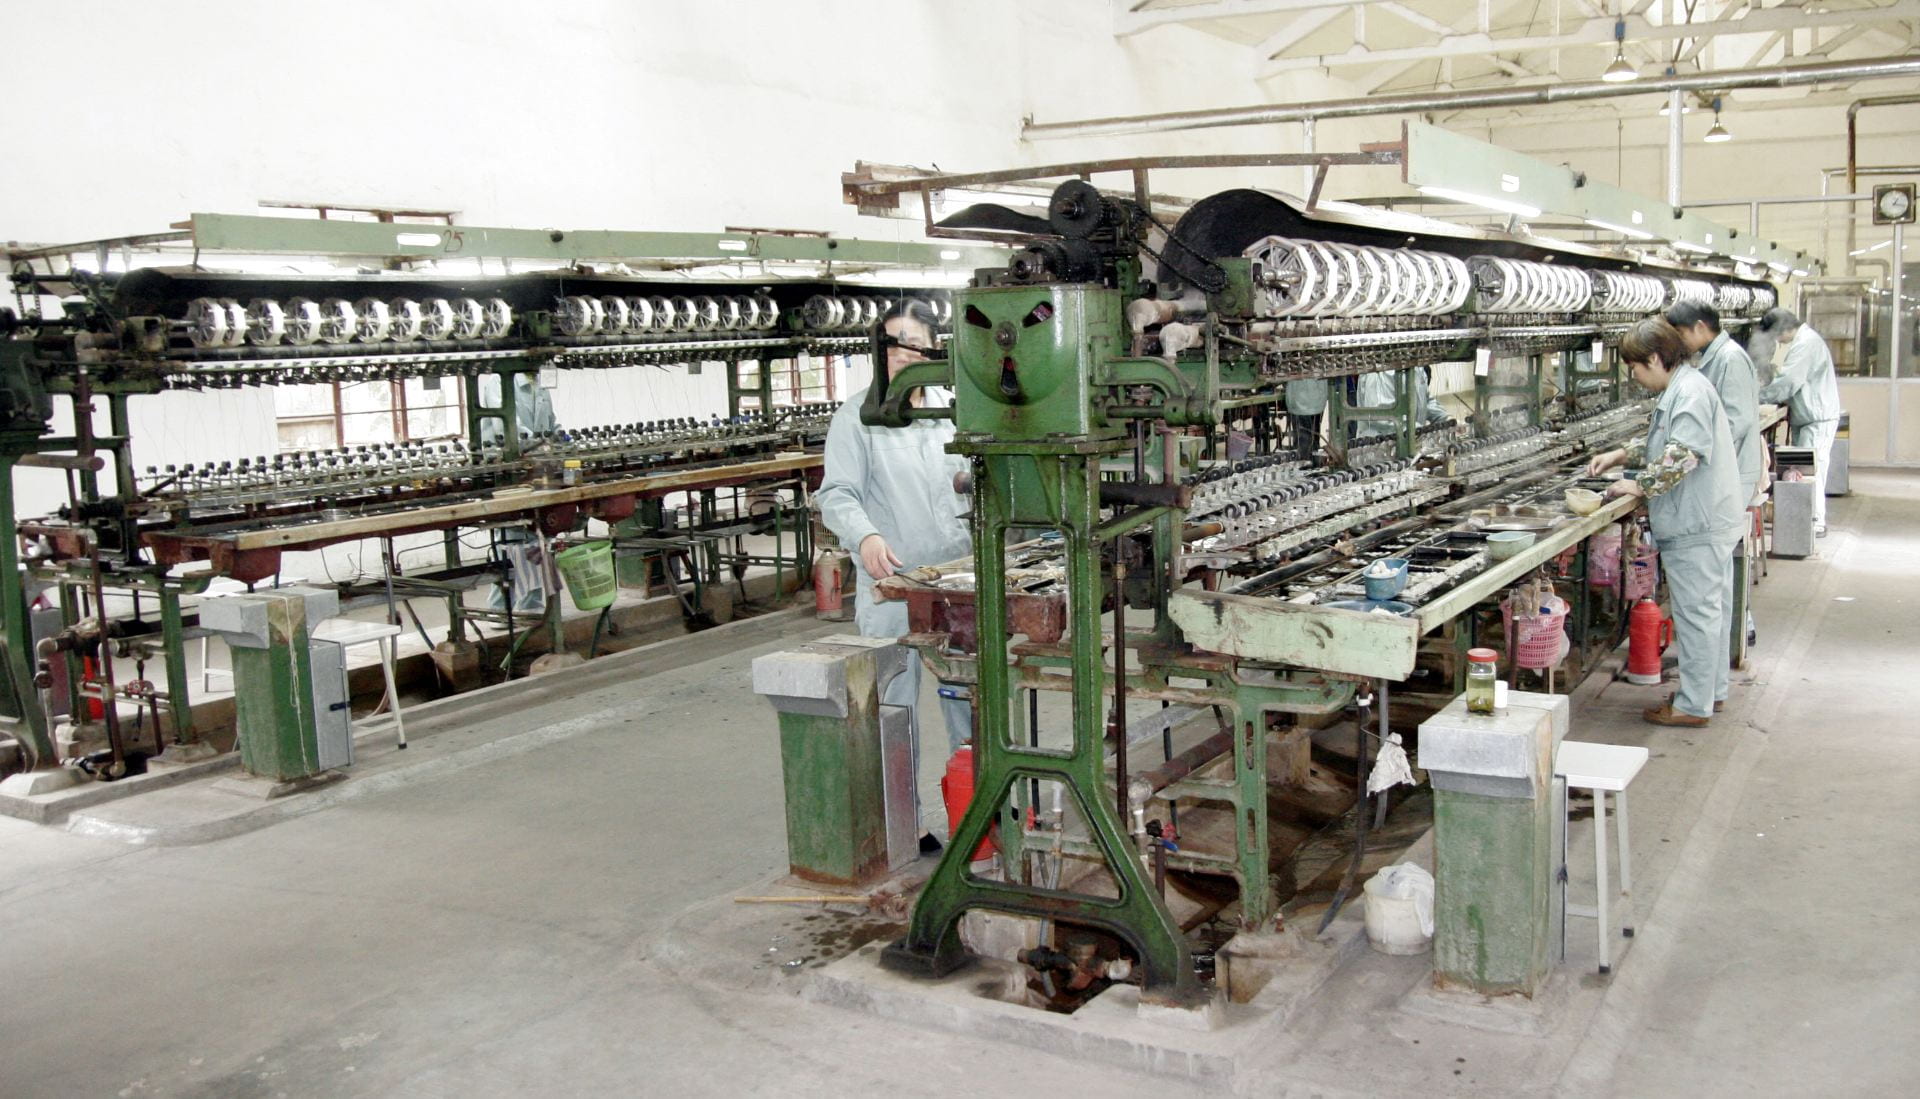
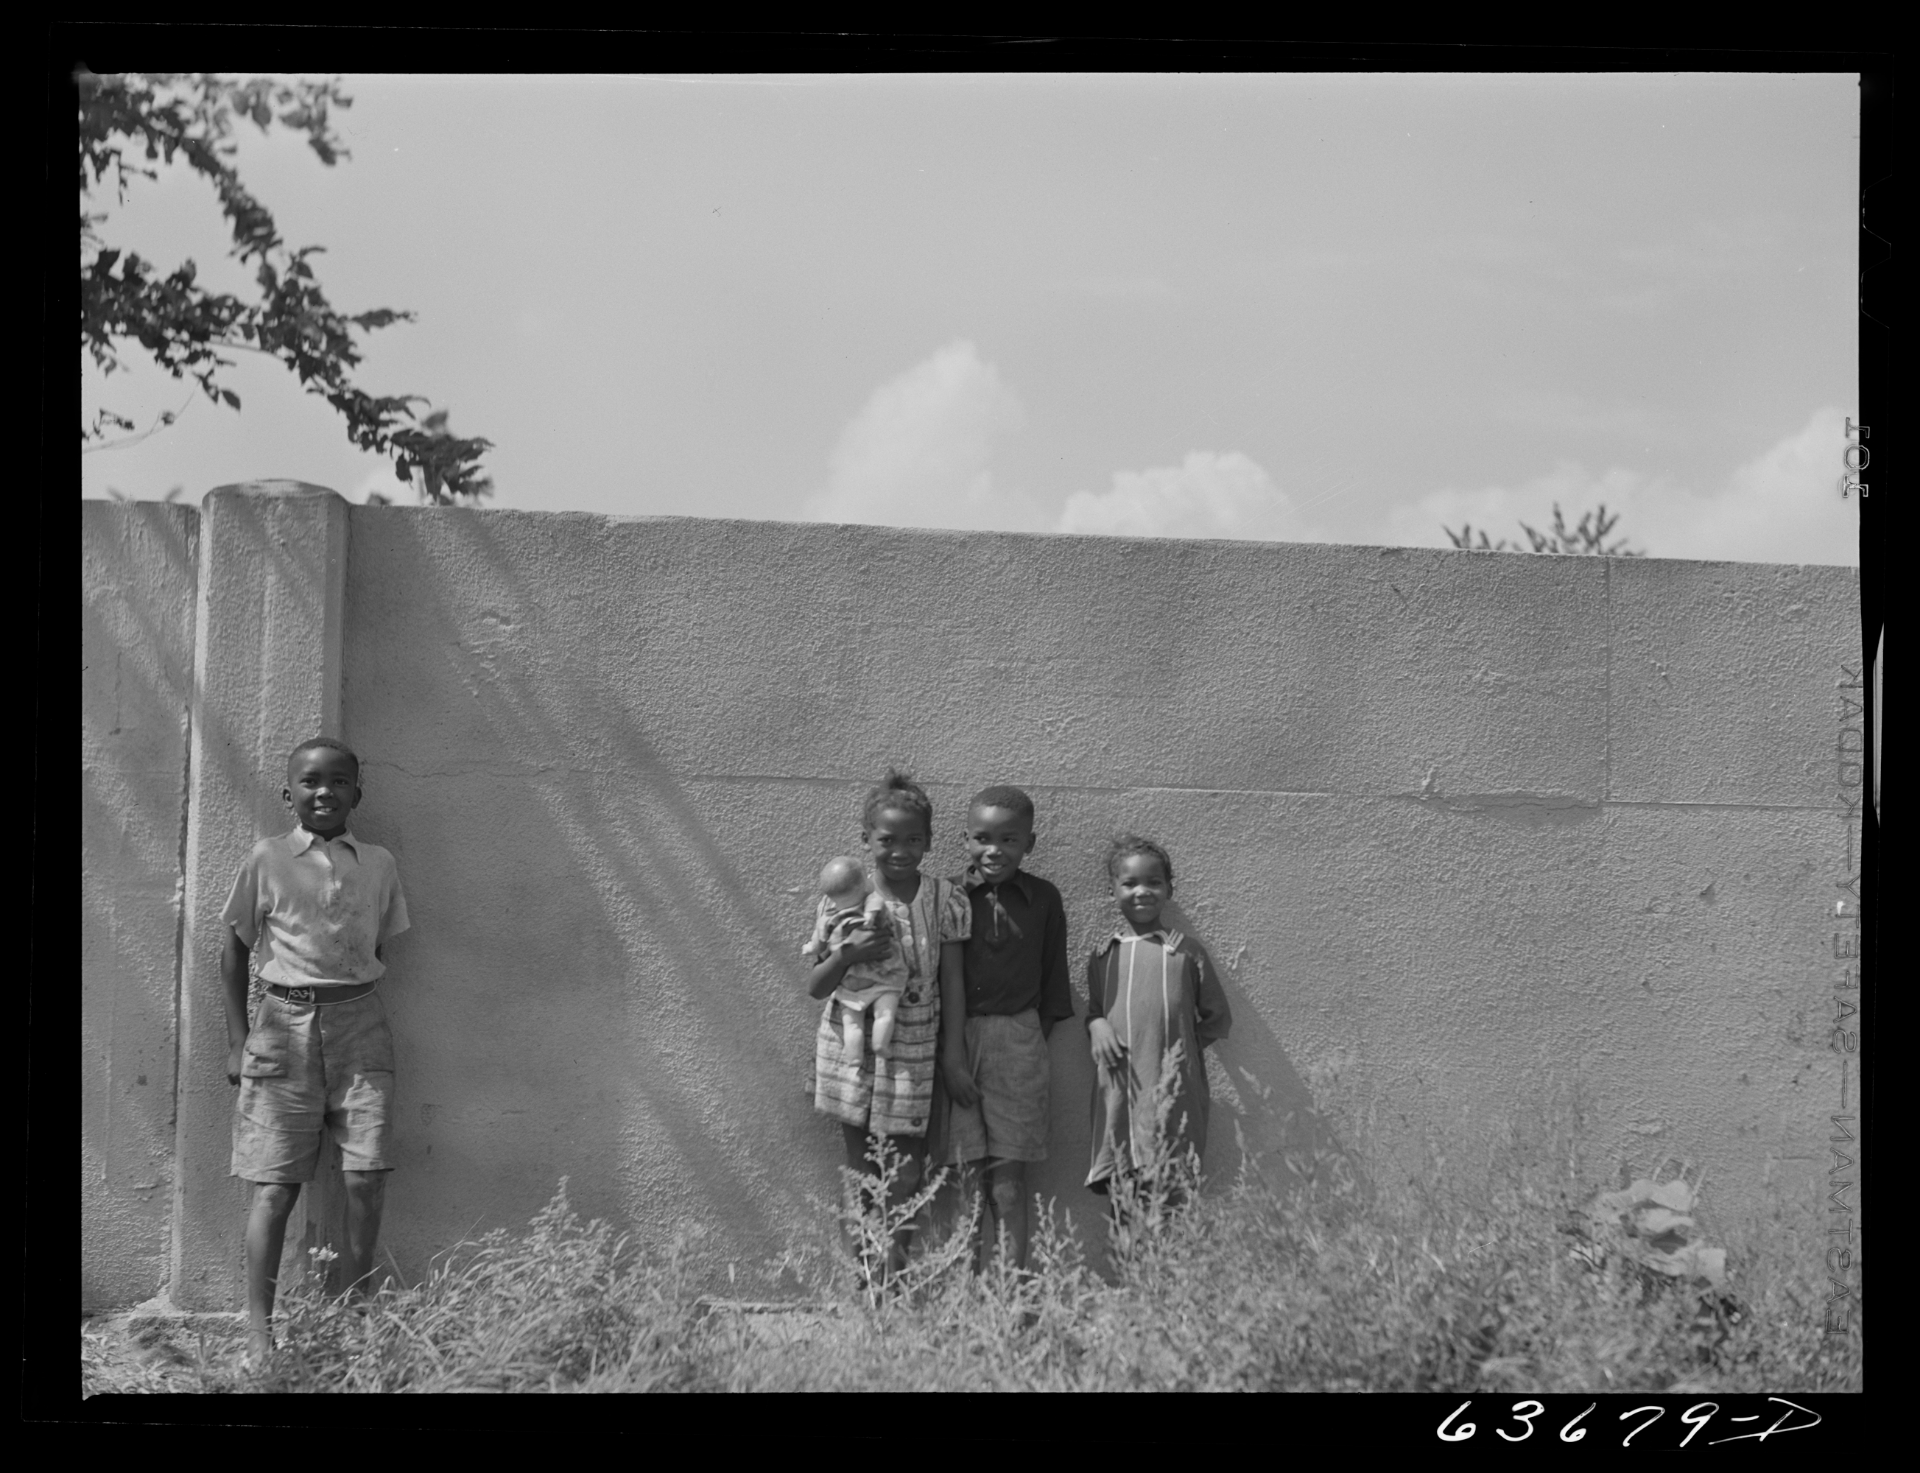
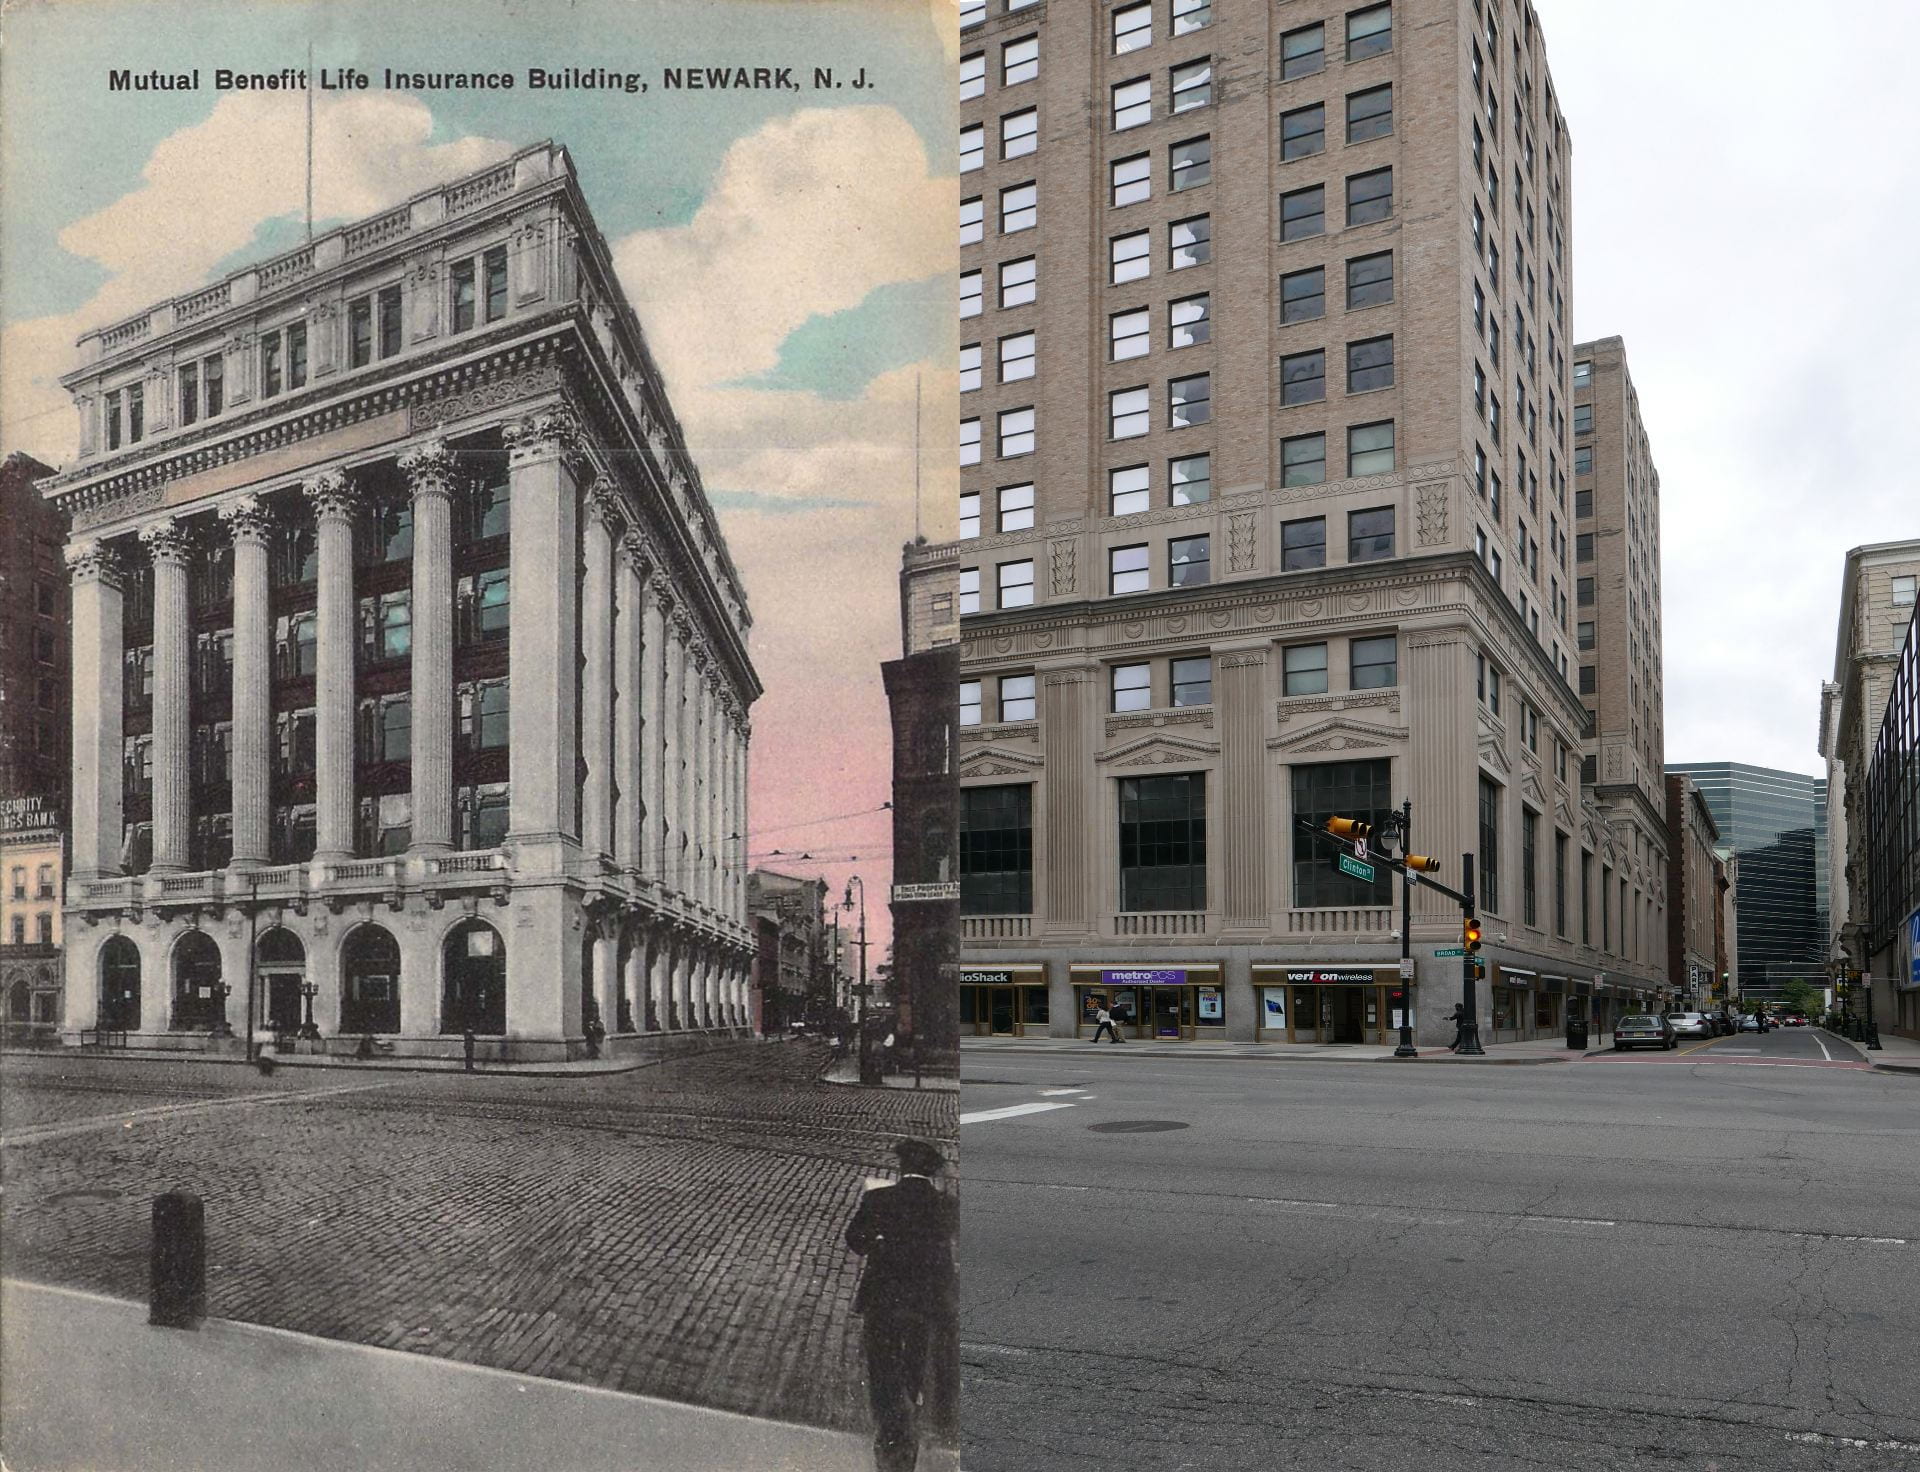
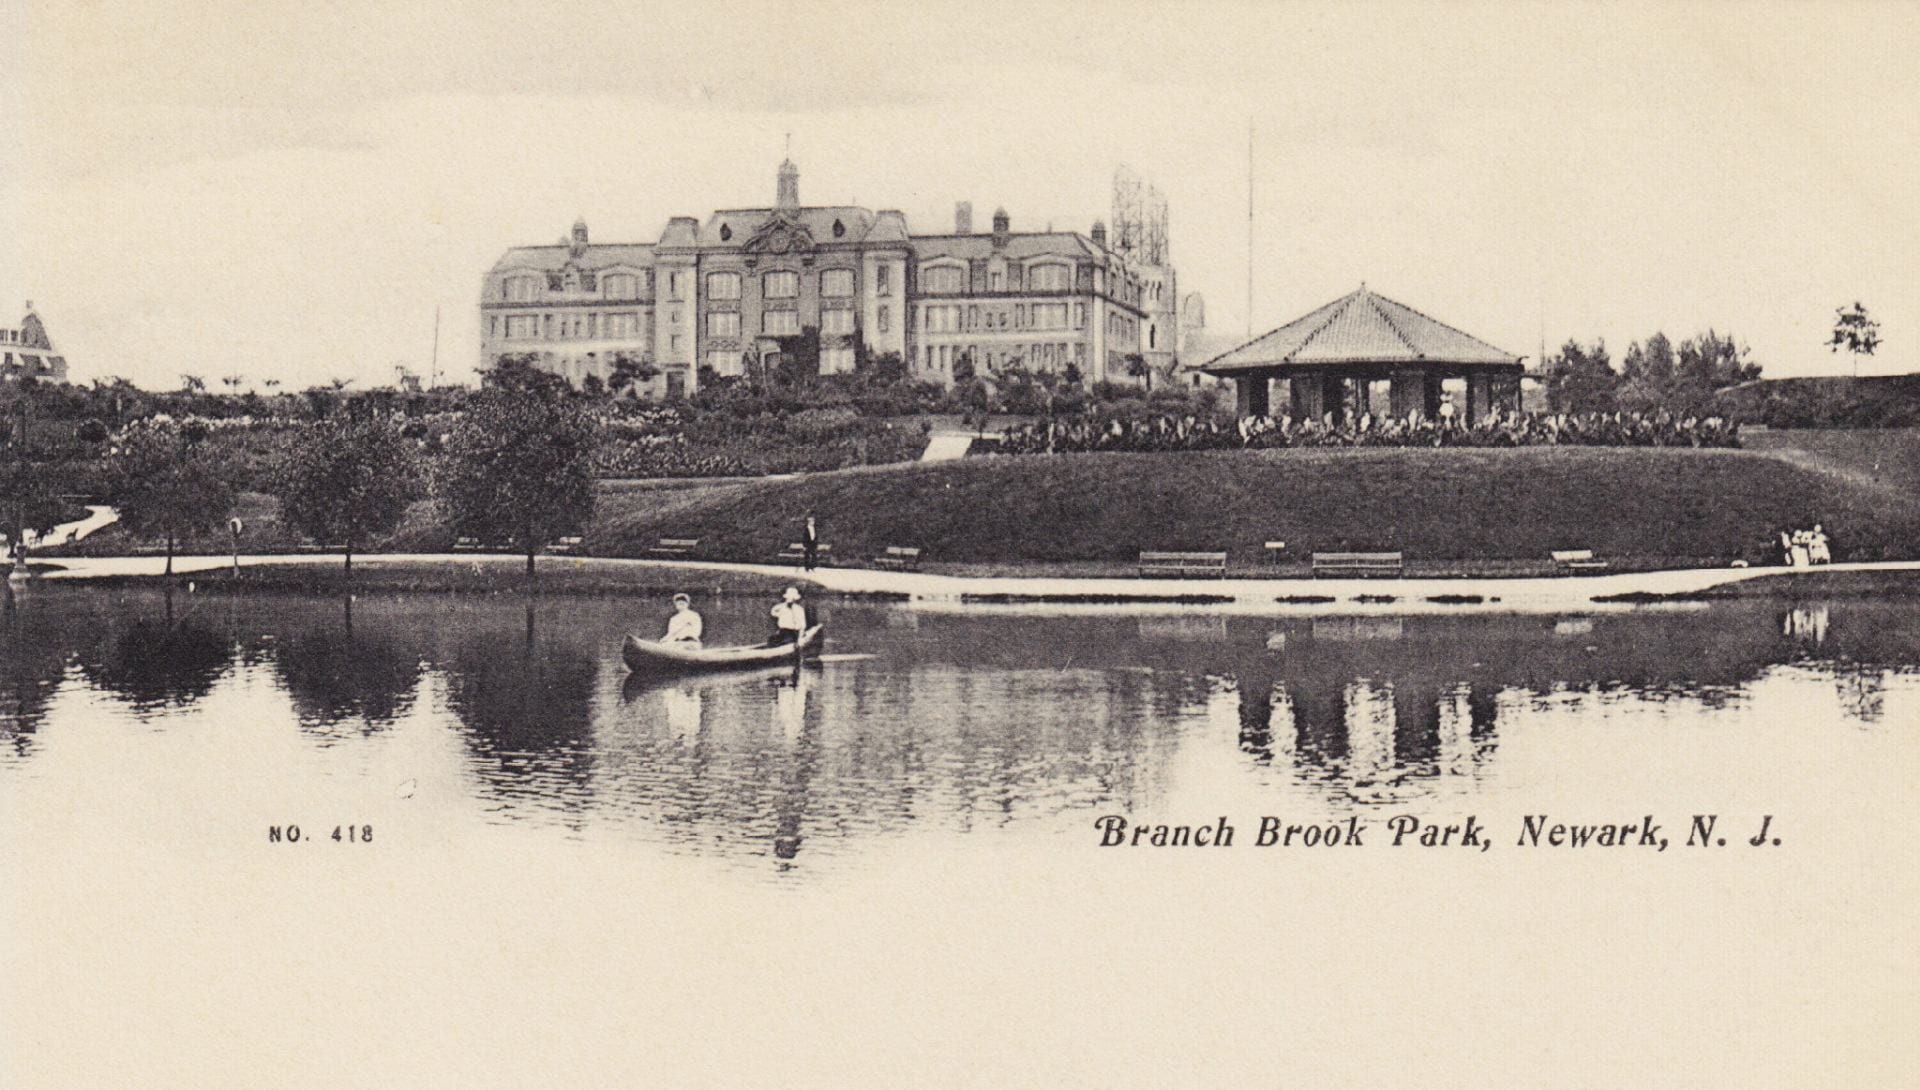
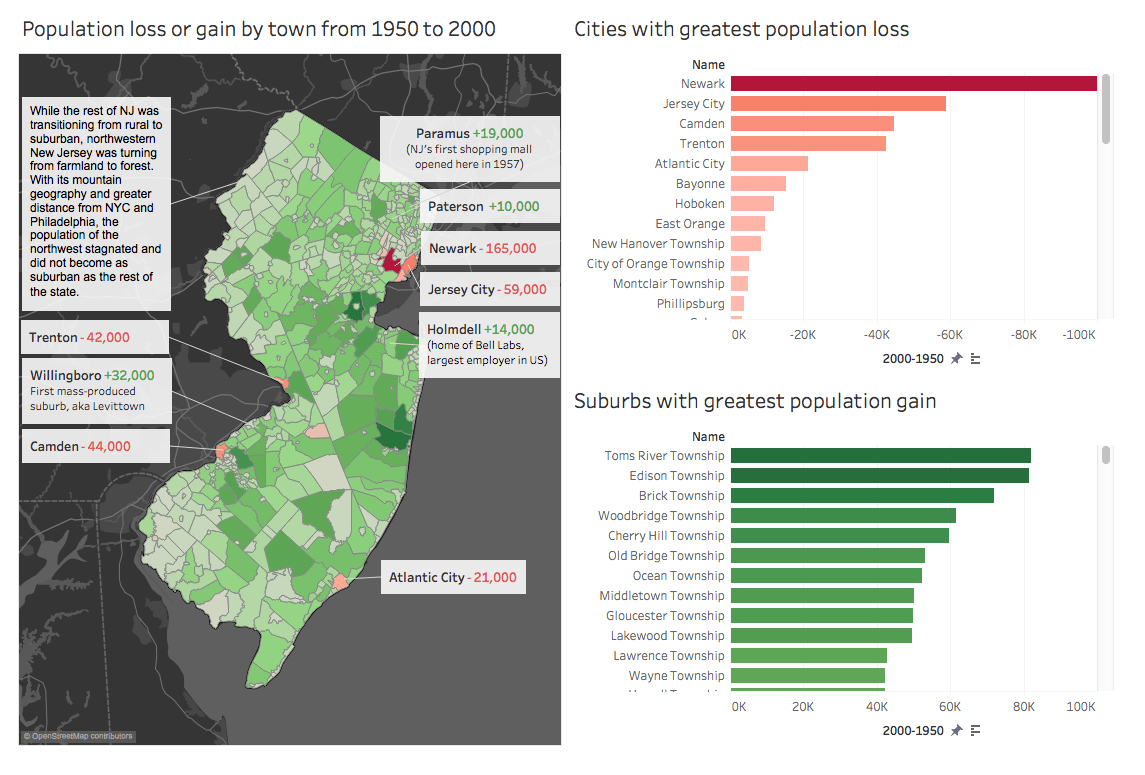
My future book project titled “Plundering the City” examines how capital and new technologies eroded the quality, density, and variety of small businesses, craft industries, neighborhood institutions, and community groups in what is now the inner-city of Newark, New Jersey. Taking one city as the prism to examine larger urban crises in American culture, this project highlights the spatial and social causes of urban poverty and impoverished social relations in American urban life. Rebuilding social infrastructure requires systemic change and seizing a new means of production.
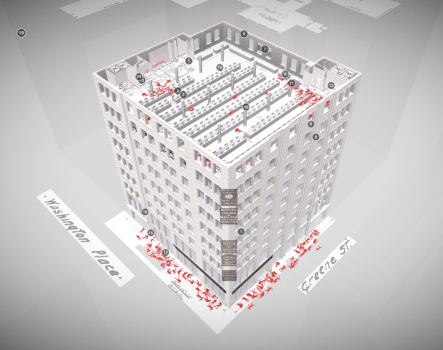
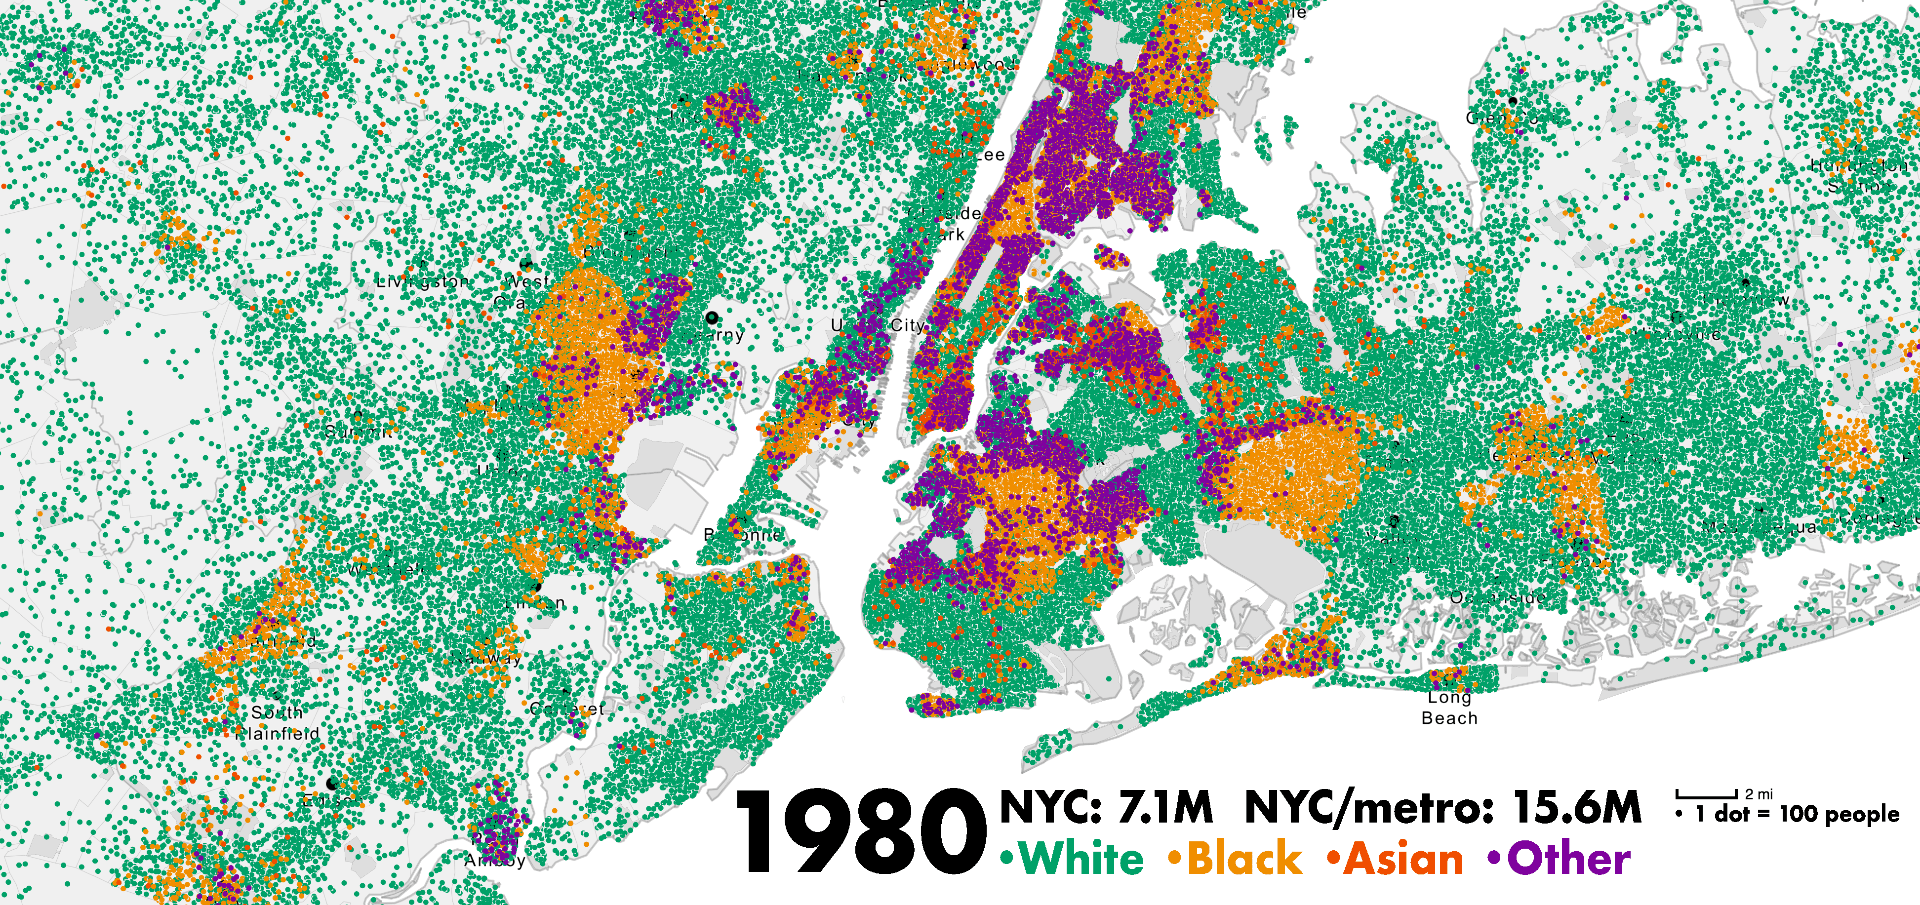
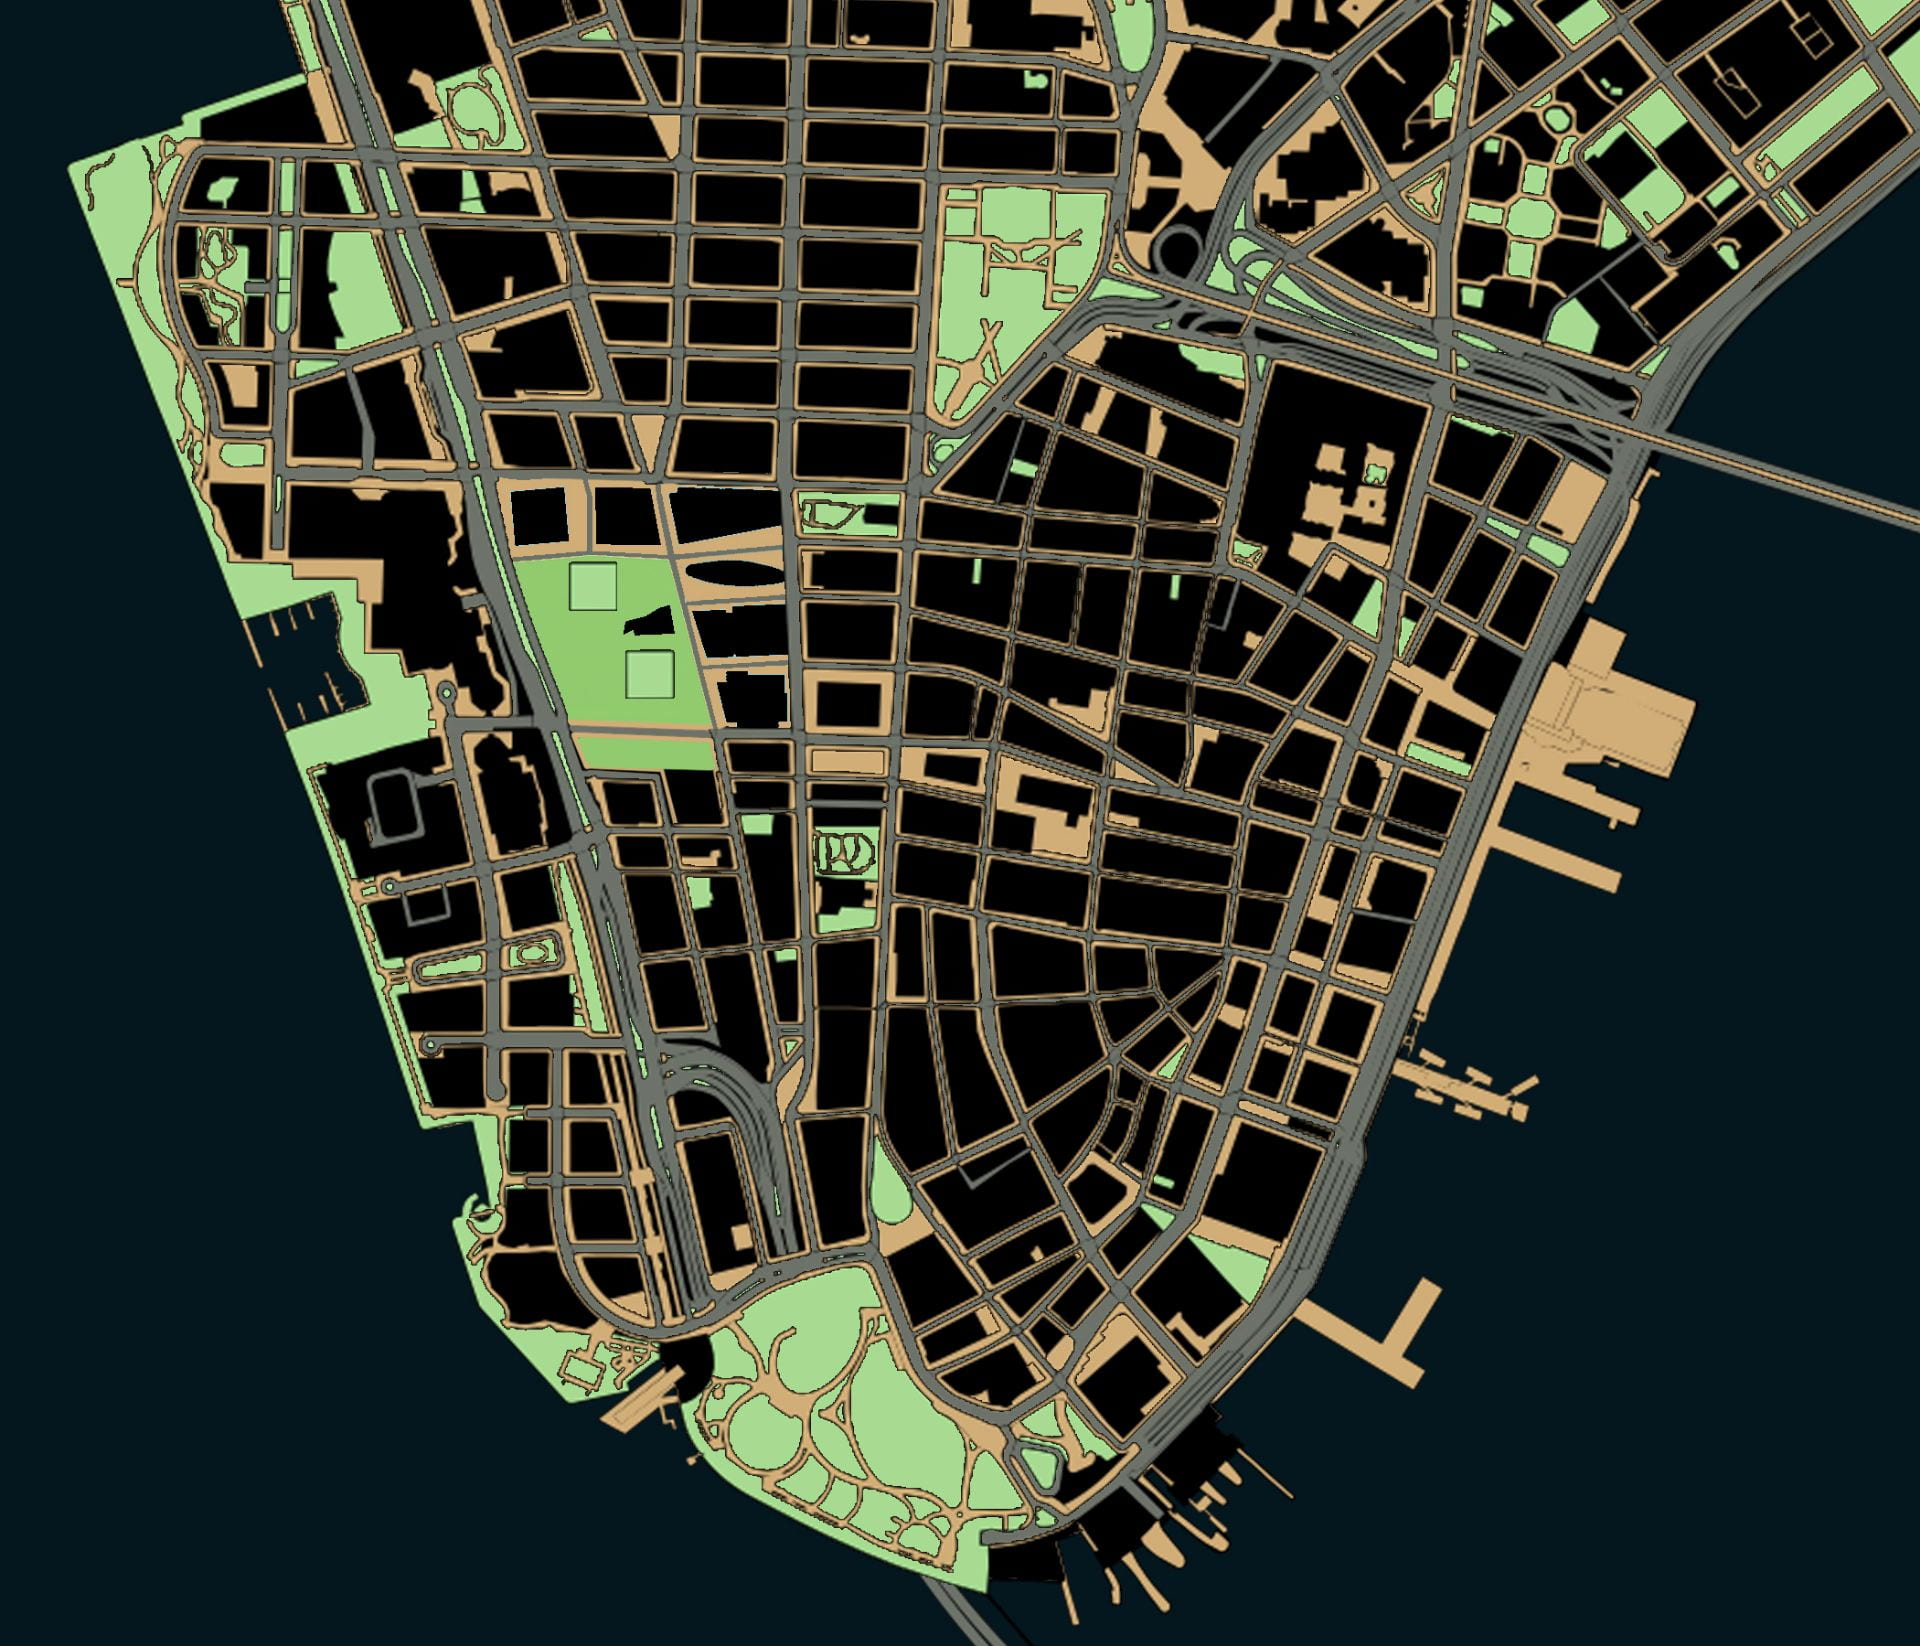
Visit: NewarkChanging.org/map VIEW PUBLICATION